Sign Up
Thank you for Submitting!

In today’s hyperconnected, cloud-first IT environments, network performance is the heartbeat of business continuity. From distributed workforces to hybrid cloud deployments, ensuring network reliability, speed, and uptime is no longer optional; it's a strategic imperative.
This blog explores the Best Network Monitoring Tools of 2025, carefully ranked based on pricing models, licensing options, feature sets, user reviews, and third-party integrations. Whether you're managing a small business network or a global IT infrastructure, these tools deliver real-time insights, automated alerts, and intelligent diagnostics to keep everything running smoothly.
What is a Network monitoring tool?
Network monitoring tools are software and hardware systems that track and analyze various aspects of a network's performance, availability, and security. They help administrators identify potential issues, optimize network performance, and ensure the network functions correctly.
What is network monitoring with an example?
There are many types of network monitoring. For instance, email network monitoring might involve sending test emails and measuring the response time. At the same time, web server testing could entail sending an HTTP request to access a given page and logging the time until it is served.
What is the purpose of monitoring tools?
A significant goal of employing a monitoring tool is to recognize and hopefully fix a problem before users become aware of it. Some of the metrics that monitoring tools can track include the following: CPU load exceeds a threshold. Network bandwidth utilization is excessive.
What are the concepts of network monitoring?
Network monitoring involves discovering devices, mapping their connections, tracking performance, reporting trends, and alerting to issues, enabling visibility and control over complex networks.
Who uses network monitoring?
Network engineers and administrators typically use network monitoring tools to collect the following metrics from network devices: Uptime.
Overview: SolarWinds NPM remains a top-tier solution for deep network visibility, performance baselining, and intelligent alerting.
SolarWinds Pricing: Starts around $1,638 per license (on-premise).
SolarWinds Licensing Options: Per-node based perpetual or subscription.
Best Use Cases: Mid-to-large enterprises and MSPs.
Pros:
Cons:
G2 Rating: 4.4/5 | Gartner Rating : 4.3/5
Screenshot:

Overview: PRTG offers an all-in-one network, server, and app monitoring platform with customizable sensors.
PRTG Pricing: Free for 100 sensors; paid starts at $1,750 for 500 sensors.
PRTG Licensing Options: Sensor-based perpetual or annual licenses.
Best Use Cases: SMBs to large organizations seeking flexibility.
Pros:
Cons:
G2 Rating: 4.6/5 / Gartner Rating : 4.5/5
Screenshot:

Overview: A trusted open-source-based monitoring tool with deep extensibility and plug-in support.
Nagios Pricing: Starts at $1,995 (up to 100 nodes).
Nagios Licensing Options: Per-node license; perpetual.
Best Use Cases: IT teams with strong Linux skills or DevOps maturity.
Pros:
Cons:
G2 Rating: 4.1/5 / Gartner Rating: 4.4/5
Screenshot:

Overview: Free and open-source enterprise monitoring tool known for its robust scalability.
Zabbix Pricing: Free; optional support plans.
Zabbix Licensing Options: Open-source; support-based tiers.
Best Use Cases: Enterprises and public sector organizations needing open tools.
Pros:
Cons:
G2 Rating: 4.4/5 / Gartner Rating: 4.6/5
Screenshot:
Overview: Combines network, server, and configuration monitoring into one powerful platform.
OpManager Pricing: Starts at $245 for 10 devices.
OpManager Licensing Options: Per-device based; standard, professional, and enterprise tiers.
Best Use Cases: SMBs to large IT operations centers.
Pros:
Cons:
G2 Rating: 4.5/5 / Gartner Rating: 4.5/5
Screenshot:

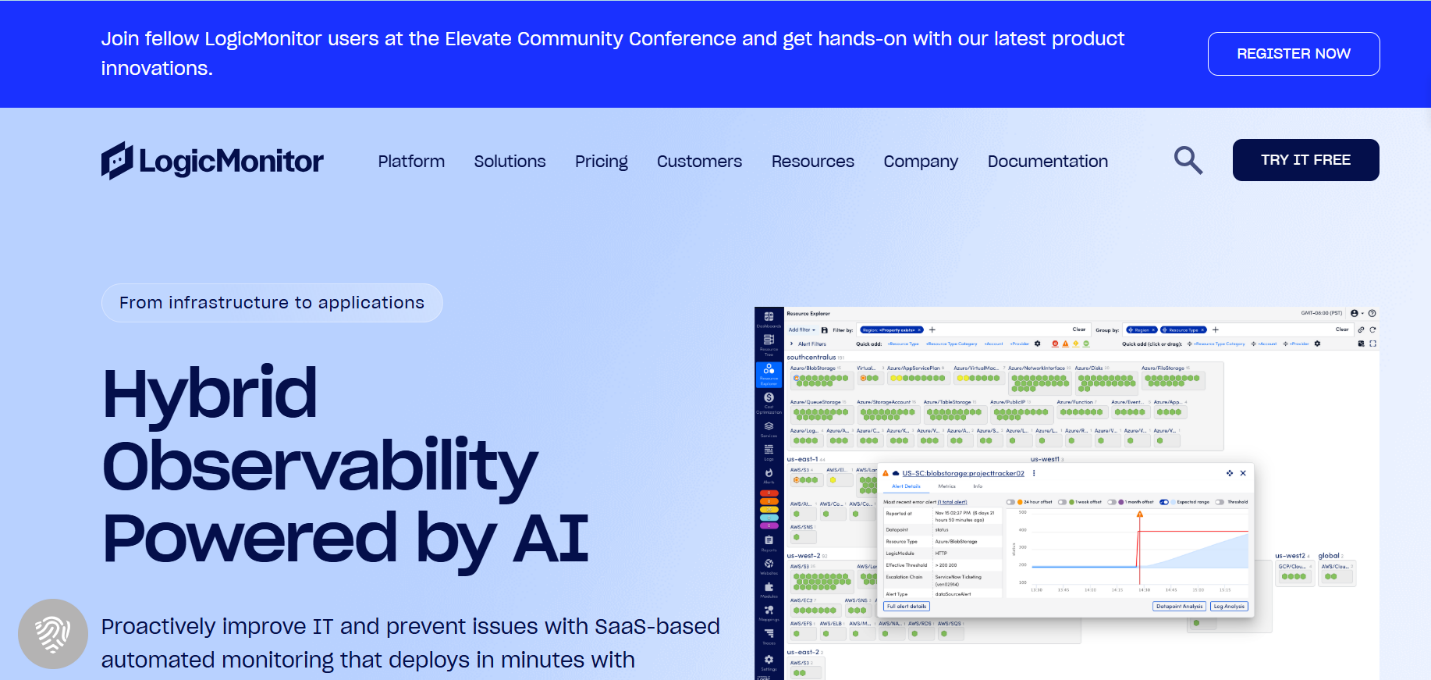
Overview: A fully cloud-based platform offering agentless monitoring and AI-driven analytics.
LogicMonitor Pricing: Custom; subscription-based per device.
LogicMonitor Licensing Options: SaaS model; device-based licensing.
Best Use Cases: Multi-cloud enterprises and MSPs.
Pros:
Cons:
G2 Rating: 4.6/5 | Gartner Rating: 3.8/5
Screenshot:
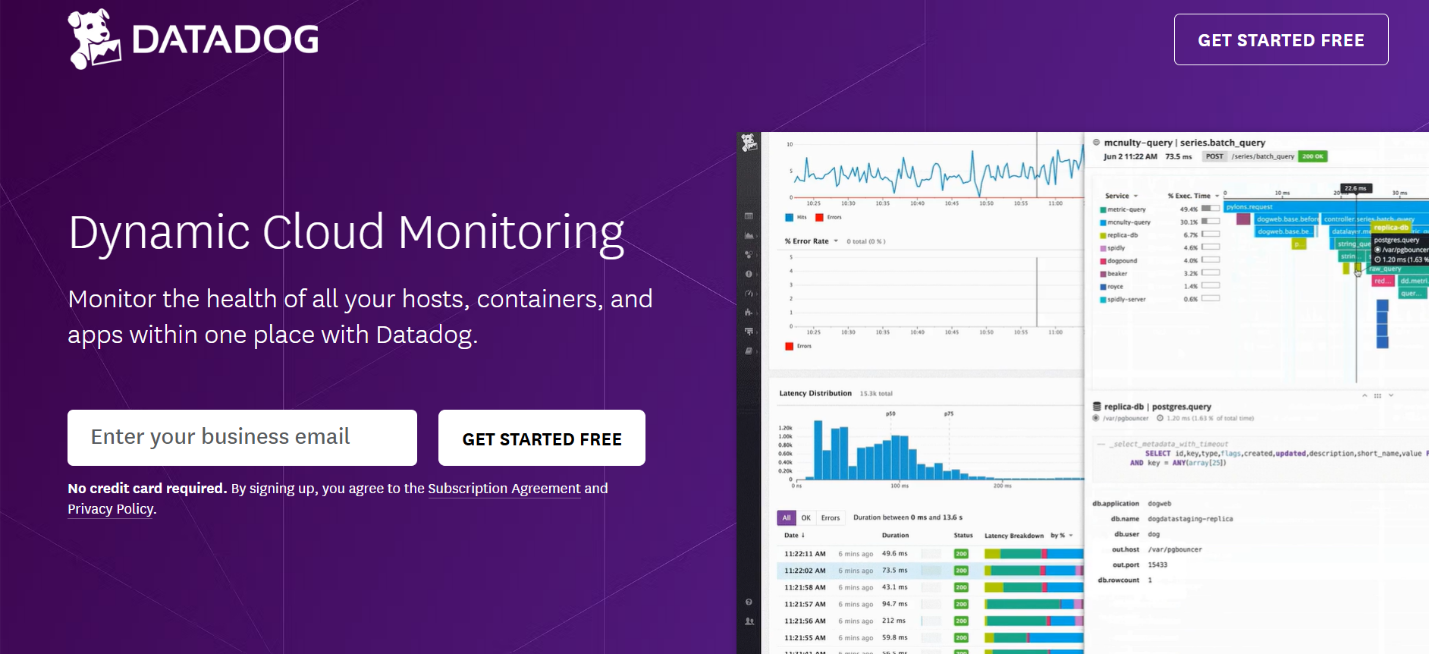
Overview: Part of the Datadog observability suite, it provides live traffic flow analysis and cloud-native support.
Datadog Pricing: Starts at $5 per host/month (for basic monitoring).
Datadog Licensing Options: Subscription, usage-based, and tiered.
Best Use Cases: DevOps and cloud-native teams.
Pros:
Cons:
G2 Rating: 4.5/5 / Gartner Rating: 4.4/5
Screenshot:
Overview: A legacy yet trusted tool offering network mapping, SNMP polling, and availability alerts.
WhatsUp Gold Pricing: Starts around $2,500.
WhatsUp Gold Licensing Options: Device-based perpetual licenses.
Best Use Cases: Small and mid-sized on-prem networks.
Pros:
Cons:
G2 Rating: 4.3/5 / Gartner Rating: 4.4/5
Screenshot:

Overview: Cloud-based network monitoring platform with auto-discovery and configuration backups.
Auvik Pricing: Per-device pricing; contact for a quote.
Auvik Licensing Options: Subscription-based SaaS.
Best Use Cases: MSPs and decentralized IT teams.
Pros:
Cons:
G2 Rating: 4.7/5 / Gartner Rating: 4.4/5
Screenshot:

Overview: An open-source infrastructure and network monitoring tool built on Nagios with a better UI.
Icinga Pricing: Free; commercial support available.
Icinga Licensing Options: Open-source with optional enterprise support.
Best Use Cases: Tech-savvy IT departments or public institutions.
Pros:
Cons:
G2 Rating: 4.2/5 / Gartner Rating: 4.3/5
Screenshot:

What is network performance monitoring?
Network performance monitoring (NPM) is the process of tracking, analyzing, and optimizing the health and performance of a network's components and operations. It involves visualizing key metrics like bandwidth utilization, latency, packet loss, and device health to ensure a stable and efficient network infrastructure.
What is a network monitoring tool?
Network monitoring provides the information that network administrators need to determine, in real time, whether a network is running optimally. With tools such as networking monitoring software, administrators can proactively identify deficiencies, optimize efficiency, and more.
Which monitoring tool is best?
There's no single "best" monitoring tool, as the ideal choice depends on the specific needs and context of the organization. However, popular and well-regarded options include Dynatrace, New Relic, Datadog, Paessler PRTG, and Nagios.
Is Jira a monitoring tool?
Atlassian JIRA is an agile project management and issue tracking tool. Install this plugin to monitor the database writes, reads, and the total issues logged in your JIRA servers.
What are the three main troubleshooting tools?
Some of the basic network troubleshooting tools are as follows: Ping. Tracert/ Trace Route. Ipconfig/ ifconfig.
Which protocol is used for network monitoring?
The Simple Network Management Protocol (SNMP) is the primary protocol used for network monitoring. SNMP is an application-layer protocol that uses a call-and-response system to check the status of network devices, like routers, switches, and servers. It collects data from these devices and transmits it to a network management system for monitoring and analysis.
Selecting the right network monitoring software means balancing cost, performance, ease of use, and scalability. Whether you need robust alerting, cloud-native visibility, or an open-source solution, the tools above cover a full range of enterprise needs in 2025.
Looking to go beyond monitoring and gain visibility into software licenses, vendor performance, and SaaS costs?
➡️ Try CloudNuro.ai , a SaaS Management Platform that integrates network data with procurement and license governance, helping IT leaders streamline decisions across the stack.
Request a no cost, no obligation free assessment —just 15 minutes to savings!
Get StartedIn today’s hyperconnected, cloud-first IT environments, network performance is the heartbeat of business continuity. From distributed workforces to hybrid cloud deployments, ensuring network reliability, speed, and uptime is no longer optional; it's a strategic imperative.
This blog explores the Best Network Monitoring Tools of 2025, carefully ranked based on pricing models, licensing options, feature sets, user reviews, and third-party integrations. Whether you're managing a small business network or a global IT infrastructure, these tools deliver real-time insights, automated alerts, and intelligent diagnostics to keep everything running smoothly.
What is a Network monitoring tool?
Network monitoring tools are software and hardware systems that track and analyze various aspects of a network's performance, availability, and security. They help administrators identify potential issues, optimize network performance, and ensure the network functions correctly.
What is network monitoring with an example?
There are many types of network monitoring. For instance, email network monitoring might involve sending test emails and measuring the response time. At the same time, web server testing could entail sending an HTTP request to access a given page and logging the time until it is served.
What is the purpose of monitoring tools?
A significant goal of employing a monitoring tool is to recognize and hopefully fix a problem before users become aware of it. Some of the metrics that monitoring tools can track include the following: CPU load exceeds a threshold. Network bandwidth utilization is excessive.
What are the concepts of network monitoring?
Network monitoring involves discovering devices, mapping their connections, tracking performance, reporting trends, and alerting to issues, enabling visibility and control over complex networks.
Who uses network monitoring?
Network engineers and administrators typically use network monitoring tools to collect the following metrics from network devices: Uptime.
Overview: SolarWinds NPM remains a top-tier solution for deep network visibility, performance baselining, and intelligent alerting.
SolarWinds Pricing: Starts around $1,638 per license (on-premise).
SolarWinds Licensing Options: Per-node based perpetual or subscription.
Best Use Cases: Mid-to-large enterprises and MSPs.
Pros:
Cons:
G2 Rating: 4.4/5 | Gartner Rating : 4.3/5
Screenshot:
Overview: PRTG offers an all-in-one network, server, and app monitoring platform with customizable sensors.
PRTG Pricing: Free for 100 sensors; paid starts at $1,750 for 500 sensors.
PRTG Licensing Options: Sensor-based perpetual or annual licenses.
Best Use Cases: SMBs to large organizations seeking flexibility.
Pros:
Cons:
G2 Rating: 4.6/5 / Gartner Rating : 4.5/5
Screenshot:
Overview: A trusted open-source-based monitoring tool with deep extensibility and plug-in support.
Nagios Pricing: Starts at $1,995 (up to 100 nodes).
Nagios Licensing Options: Per-node license; perpetual.
Best Use Cases: IT teams with strong Linux skills or DevOps maturity.
Pros:
Cons:
G2 Rating: 4.1/5 / Gartner Rating: 4.4/5
Screenshot:
Overview: Free and open-source enterprise monitoring tool known for its robust scalability.
Zabbix Pricing: Free; optional support plans.
Zabbix Licensing Options: Open-source; support-based tiers.
Best Use Cases: Enterprises and public sector organizations needing open tools.
Pros:
Cons:
G2 Rating: 4.4/5 / Gartner Rating: 4.6/5
Screenshot:
Overview: Combines network, server, and configuration monitoring into one powerful platform.
OpManager Pricing: Starts at $245 for 10 devices.
OpManager Licensing Options: Per-device based; standard, professional, and enterprise tiers.
Best Use Cases: SMBs to large IT operations centers.
Pros:
Cons:
G2 Rating: 4.5/5 / Gartner Rating: 4.5/5
Screenshot:
Overview: A fully cloud-based platform offering agentless monitoring and AI-driven analytics.
LogicMonitor Pricing: Custom; subscription-based per device.
LogicMonitor Licensing Options: SaaS model; device-based licensing.
Best Use Cases: Multi-cloud enterprises and MSPs.
Pros:
Cons:
G2 Rating: 4.6/5 | Gartner Rating: 3.8/5
Screenshot:
Overview: Part of the Datadog observability suite, it provides live traffic flow analysis and cloud-native support.
Datadog Pricing: Starts at $5 per host/month (for basic monitoring).
Datadog Licensing Options: Subscription, usage-based, and tiered.
Best Use Cases: DevOps and cloud-native teams.
Pros:
Cons:
G2 Rating: 4.5/5 / Gartner Rating: 4.4/5
Screenshot:
Overview: A legacy yet trusted tool offering network mapping, SNMP polling, and availability alerts.
WhatsUp Gold Pricing: Starts around $2,500.
WhatsUp Gold Licensing Options: Device-based perpetual licenses.
Best Use Cases: Small and mid-sized on-prem networks.
Pros:
Cons:
G2 Rating: 4.3/5 / Gartner Rating: 4.4/5
Screenshot:
Overview: Cloud-based network monitoring platform with auto-discovery and configuration backups.
Auvik Pricing: Per-device pricing; contact for a quote.
Auvik Licensing Options: Subscription-based SaaS.
Best Use Cases: MSPs and decentralized IT teams.
Pros:
Cons:
G2 Rating: 4.7/5 / Gartner Rating: 4.4/5
Screenshot:
Overview: An open-source infrastructure and network monitoring tool built on Nagios with a better UI.
Icinga Pricing: Free; commercial support available.
Icinga Licensing Options: Open-source with optional enterprise support.
Best Use Cases: Tech-savvy IT departments or public institutions.
Pros:
Cons:
G2 Rating: 4.2/5 / Gartner Rating: 4.3/5
Screenshot:
What is network performance monitoring?
Network performance monitoring (NPM) is the process of tracking, analyzing, and optimizing the health and performance of a network's components and operations. It involves visualizing key metrics like bandwidth utilization, latency, packet loss, and device health to ensure a stable and efficient network infrastructure.
What is a network monitoring tool?
Network monitoring provides the information that network administrators need to determine, in real time, whether a network is running optimally. With tools such as networking monitoring software, administrators can proactively identify deficiencies, optimize efficiency, and more.
Which monitoring tool is best?
There's no single "best" monitoring tool, as the ideal choice depends on the specific needs and context of the organization. However, popular and well-regarded options include Dynatrace, New Relic, Datadog, Paessler PRTG, and Nagios.
Is Jira a monitoring tool?
Atlassian JIRA is an agile project management and issue tracking tool. Install this plugin to monitor the database writes, reads, and the total issues logged in your JIRA servers.
What are the three main troubleshooting tools?
Some of the basic network troubleshooting tools are as follows: Ping. Tracert/ Trace Route. Ipconfig/ ifconfig.
Which protocol is used for network monitoring?
The Simple Network Management Protocol (SNMP) is the primary protocol used for network monitoring. SNMP is an application-layer protocol that uses a call-and-response system to check the status of network devices, like routers, switches, and servers. It collects data from these devices and transmits it to a network management system for monitoring and analysis.
Selecting the right network monitoring software means balancing cost, performance, ease of use, and scalability. Whether you need robust alerting, cloud-native visibility, or an open-source solution, the tools above cover a full range of enterprise needs in 2025.
Looking to go beyond monitoring and gain visibility into software licenses, vendor performance, and SaaS costs?
➡️ Try CloudNuro.ai , a SaaS Management Platform that integrates network data with procurement and license governance, helping IT leaders streamline decisions across the stack.
Request a no cost, no obligation free assessment - just 15 minutes to savings!
Get StartedWe're offering complimentary ServiceNow license assessments to only 25 enterprises this quarter who want to unlock immediate savings without disrupting operations.
Get Free AssessmentGet Started


CloudNuro Corp
1755 Park St. Suite 207
Naperville, IL 60563
Phone : +1-630-277-9470
Email: info@cloudnuro.com


.webp)

Recognized Leader in SaaS Management Platforms by Info-Tech SoftwareReviews