
Sign Up
Thank you for Submitting!
As demonstrated by forward-thinking organizations and shared through the FinOps Foundation’s community stories, this case reflects practical strategies enterprises are using to reclaim control over cloud and SaaS spending.
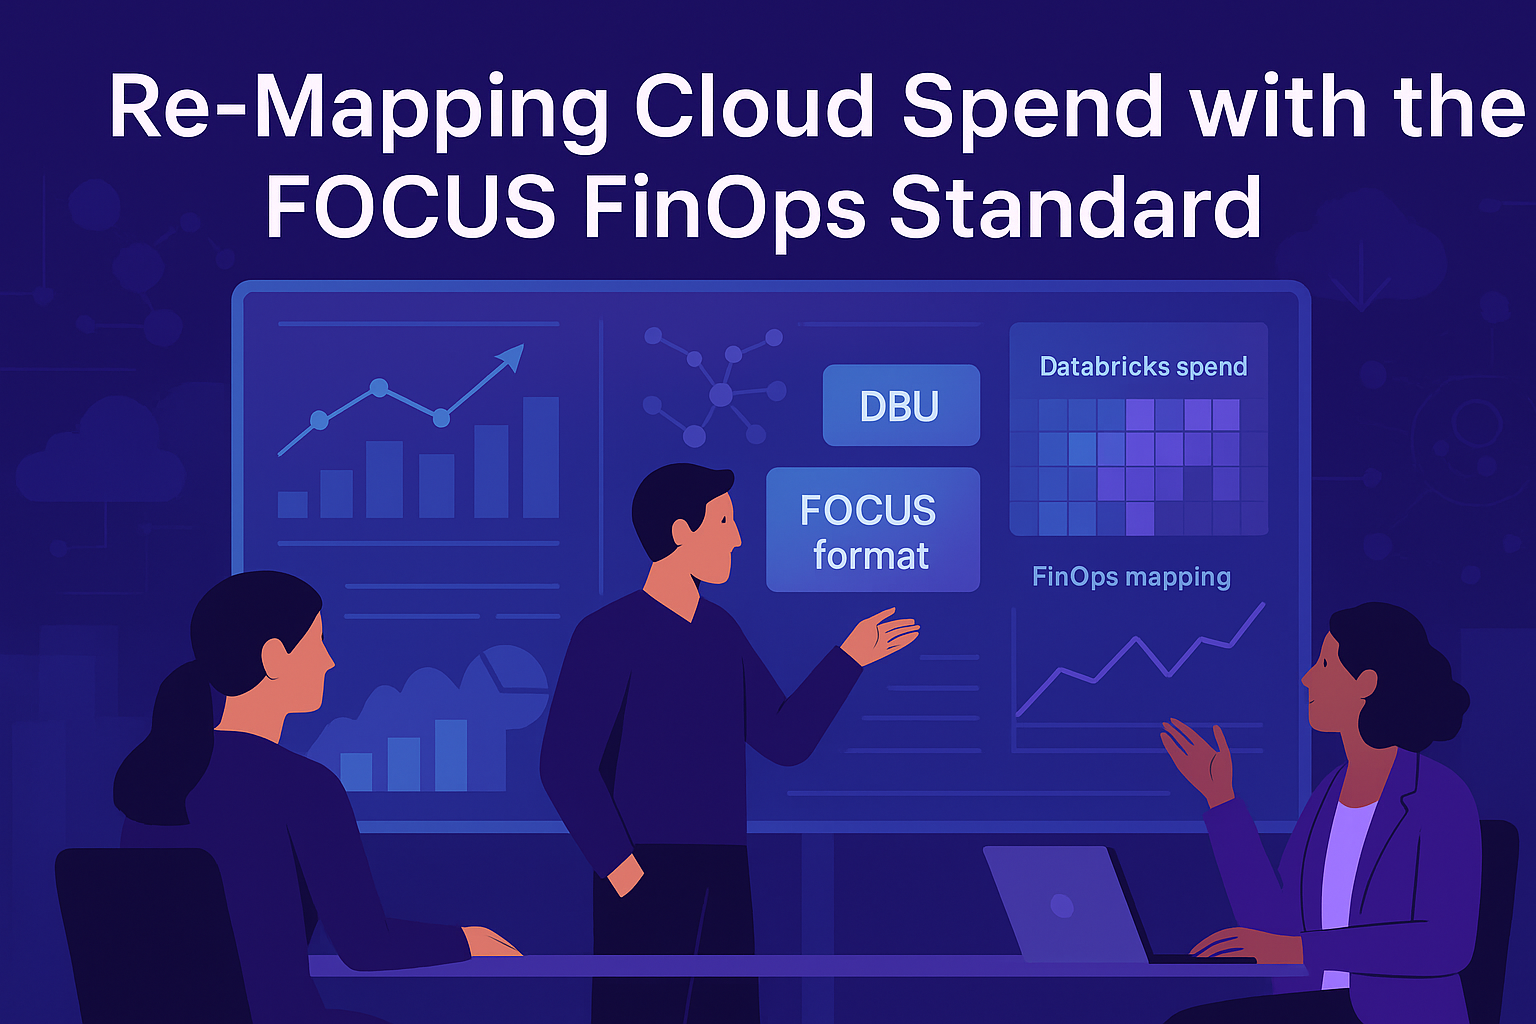
When cloud spending spirals beyond visibility, accountability becomes elusive, and optimization almost impossible. It was precisely the challenge faced by a large mining enterprise that had heavily invested in Databricks for machine learning, AI exploration, and IoT data processing across mining operations. While Databricks’ consumption-based pricing provided flexibility, the lack of standardized cost data made it nearly impossible to allocate cloud costs accurately, identify waste, or enable business units to take ownership of their spending.
That’s where the FOCUS FinOps cloud cost data standard entered the picture. With aspirations to improve cost accountability, automate ingestion, and enable FinOps platform integration, this AI-driven organization embarked on a journey to transform Databricks cost data into the FOCUS specification, ultimately aligning its cloud strategy with business goals.
These are the exact types of problems CloudNuro.ai was built to solve, across cloud and SaaS.
For this global data-and-AI enterprise, operating complex analytics, machine learning, and IoT workloads, the promise of Databricks was performance at scale. But the reality of managing cost allocation for DBU-based billing across multi-cloud deployments was anything but easy. Despite Databricks offering usage tables and internal dashboards, these tools failed to deliver the standardized, business-aligned visibility the FinOps team needed.
What followed was a deeply technical and strategic effort to adopt the FOCUS FinOps cloud cost data format, operationalize ingestion, and unlock cost ownership across teams.
The team realized early on that Databricks’ native system tables (e.g., system.billing.usage, system.billing.list_prices) offered raw billing data, but not in a form aligned with the FOCUS spec. This meant they couldn’t plug cost into their chosen FinOps platform, or track trends across clouds, products, or services.
Internally, frustration mounted:
What made it worse? Each Databricks SKU had different price points based on region, compute type, and deployment model, yet this granularity was invisible to most of the business.
The team began by downloading the FOCUS 1.0 and 1.1 specs. But as they discovered, the schema wasn’t plug-and-play. FOCUS expected 35+ columns such as:
billing_period_start and billing_period_endusage_dateservice_name, usage_type, resource_idcost, currency, regionYet Databricks tables didn’t offer many of these fields directly:
So, they built a translation matrix: Column A was the FOCUS spec, Column B was what Databricks provided, and Column C were derived fields. Everything was documented in GitHub, with inline markdown explaining each SQL transformation and its reasoning.
They used GitHub Copilot to iterate on logic:
By breaking down the FOCUS schema into “consumable bites,” the team built SQL queries that created 100% FOCUS-conformant datasets, including workarounds for fields like sku_id, service_id, and usage granularity.
“We weren’t going to wait for the vendor. We used what they gave us, mapped it to what we needed, and built an ETL layer around it.”, Cloud Cost Architect
Databricks Notebooks became the orchestration layer. The logic was broken down into three distinct stages:
system.billing.usage and list_prices with start_date and end_date filtersservice_name was inferred from origin product fields
Before pushing to the FinOps platform, the team used Databricks' own BI tools to validate the output. They created in-notebook dashboards:
These dashboards weren’t just internal—they were shared across:
This data democratization seeded early buy-in across the business—even before chargeback was implemented.
One sticking point nearly stalled the project: their ingestion platform didn’t accept timestamps with milliseconds. The FOCUS spec implied ISO 8601 compliance—including milliseconds.
A Slack message to the FinOps Foundation community led to:
YYYY-MM-DDTHH:MM:SSZ and proceedThis episode crystallized why FinOps isn’t just a role—it’s a movement. Standards aren’t just documents—they’re relationships, shared knowledge, and collective success.
Curious how leading enterprises fast-track FinOps with zero rework? See how CloudNuro quietly powers success behind the scenes.
What began as a focused technical exercise—transforming Databricks billing into the FOCUS FinOps cloud cost data standard—evolved into a business-wide transformation in cost ownership, trust, and optimization.
By standardizing cost data, automating ingestion, and enabling analysis across teams, this AI-driven enterprise turned cost chaos into clarity—and realized both financial savings and behavioral change.
Before this project, most teams could only see blended DBU spend by environment or account. After implementing the FOCUS pipeline:
The FinOps platform visualizations began showing:
Before: Monthly CSV extracts and manual pivot tables
After: Daily dashboards driving automated alerts and budget actions
“Now when someone asks ‘why did our cloud bill spike?’, we can answer in under 10 minutes—not 10 days.” — Sr. Manager, Cloud Engineering
The team’s primary savings came from behavioral and architectural shifts, not negotiated discounts:
These shifts led to:
The team also gained leverage in procurement discussions—armed with precise per-SKU usage patterns.
Wondering what’s really driving your cloud costs—and how to take control? Explore how CloudNuro uncovers answers your teams can act on.
Once cost data conformed to FOCUS, the FinOps team could apply chargeback or showback policies with confidence. Business units received reports showing:
This transparency reduced tension between engineering and finance. Teams began forecasting compute needs proactively, not reactively.
Finance finally saw unit economics per use case:
“FOCUS gave us a language to talk to the business. It was no longer about raw DBUs—it was about outcomes.” — Director, Enterprise IT Finance
With FOCUS-formatted cost data ingested daily, the FinOps platform could:
This set the stage for:
The CIO began using cloud cost per experiment as a key metric in quarterly reviews.
CloudNuro supports both license-based and usage-based chargeback across SaaS and cloud, with policy-driven allocations and dashboard-ready outputs. - Ready to see a Sample ->
Without FinOps Foundation Slack and GitHub collaboration, this journey might’ve taken 2x longer. The team credits:
Their GitHub repo is now used by multiple organizations looking to transform Databricks usage into FOCUS format—cutting down implementation time for others.
They even received early previews from Databricks confirming native FOCUS export is coming, validating their advocacy efforts.
Near the end of this project, Databricks announced a private preview of native FOCUS-format cost export—something that hadn’t existed when this team began.
Their feedback, code contribution, and user story helped push the vendor to prioritize this feature.
This showcases a broader lesson: when enterprises lead, vendors listen.
This case study reveals more than just a cost transformation—it exposes a repeatable, cross-domain blueprint for adopting the FOCUS FinOps cloud cost data standard. Whether you're working with Databricks, Snowflake, ServiceNow, or any SaaS/IaaS vendor, the same challenges, breakthroughs, and best practices apply.
Let’s unpack the critical learnings every FinOps team, cloud architect, and IT finance leader should take away.
One of the most powerful takeaways: the absence of native FOCUS support is not a blocker.
This team didn’t wait for Databricks to build FOCUS-formatted exports. Instead, they:
By building the bridge themselves, they:
If your FinOps journey is stuck waiting on SaaS providers, you’re not doing FinOps—you’re doing wishful thinking.
Fascinated by how it all connects? Discover how CloudNuro bridges your SaaS and cloud data, out of the box.
The FOCUS format gave this organization a shared language between finance, engineering, and product. No more debates about:
Once FOCUS was in place, dashboards showed normalized costs with consistent columns—regardless of source. This meant:
The result? Less friction, more accountability, and fewer surprises.
Data is powerful—but visualizations drive action.
In this case, pre-FinOps charts were isolated, raw, and unreadable by business stakeholders. Post-FOCUS dashboards revealed:
Dashboards weren’t confined to IT. They were:
Visualization made cloud cost everyone’s problem—and opportunity.
FOCUS helped normalize fields, but insight comes from contextual enrichment.
This team went beyond:
usage_type = "SQL Compute"They added:
team_ownerbusiness_unitenvironmentproject_nameThis metadata was captured at ingestion or joined from other internal systems. It enabled dashboards that answered:
Cloud cost became a unit of business productivity—not just an IT line item.
What if your cost reports spoke your org’s language? See how CloudNuro maps spend to the dimensions that matter—automatically.
ETL—Extract, Transform, Load—might sound technical, but it’s foundational to FinOps success.
This case proves:
By operationalizing the flow, this team ensured:
Every FinOps team should have a data operations playbook—and a team that owns it.
The team’s most unexpected advantage? Slack.
A timestamp formatting issue threatened to derail ingestion. Within an hour, peers from Datadog, Walmart, and the FinOps Foundation clarified the spec and confirmed a simple fix.
This saved:
Community input helped:
Open-source code, shared knowledge, and Slack channels were as critical as cloud tooling. FinOps is not just a discipline—it’s a movement.
“You’re never the only one solving this problem. Ask. Share. Collaborate. That’s how you do FinOps right.”
At the start, Databricks didn’t support FOCUS-formatted exports. The team took two actions:
By the end of the project, Databricks had announced a private preview of FOCUS support—accelerated by community feedback.
Vendors respond to clear, repeated demand. When FinOps practitioners lead, platforms follow.
This case study illustrates what’s possible when an enterprise doesn’t wait for perfection—but builds it. By transforming raw billing exports into standardized, FOCUS-aligned cloud cost data, this AI-first organization achieved:
But most importantly, they unlocked organizational confidence—finance could plan, engineering could optimize, and leadership could measure.
Now imagine doing this not just for Databricks, but across:
That’s what CloudNuro.ai enables.
CloudNuro helps you:
We don’t replace your cloud or SaaS tools—we help you finally understand them.
Want to replicate this transformation?
Book a free FinOps insights demo with CloudNuro.ai to identify waste, enable chargeback, and drive accountability across your tech stack.
This quote underscores the real transformation: FOCUS wasn’t just a data format—it was a trust enabler. It allowed teams across IT, product, and finance to collaborate using the same source of truth.
Ready to shift from reactive firefighting to confident financial strategy? Learn how CloudNuro makes that transition seamless.
This story was originally shared with the FinOps Foundation as part of their enterprise case study series.
Request a no cost, no obligation free assessment —just 15 minutes to savings!
Get StartedAs demonstrated by forward-thinking organizations and shared through the FinOps Foundation’s community stories, this case reflects practical strategies enterprises are using to reclaim control over cloud and SaaS spending.
When cloud spending spirals beyond visibility, accountability becomes elusive, and optimization almost impossible. It was precisely the challenge faced by a large mining enterprise that had heavily invested in Databricks for machine learning, AI exploration, and IoT data processing across mining operations. While Databricks’ consumption-based pricing provided flexibility, the lack of standardized cost data made it nearly impossible to allocate cloud costs accurately, identify waste, or enable business units to take ownership of their spending.
That’s where the FOCUS FinOps cloud cost data standard entered the picture. With aspirations to improve cost accountability, automate ingestion, and enable FinOps platform integration, this AI-driven organization embarked on a journey to transform Databricks cost data into the FOCUS specification, ultimately aligning its cloud strategy with business goals.
These are the exact types of problems CloudNuro.ai was built to solve, across cloud and SaaS.
For this global data-and-AI enterprise, operating complex analytics, machine learning, and IoT workloads, the promise of Databricks was performance at scale. But the reality of managing cost allocation for DBU-based billing across multi-cloud deployments was anything but easy. Despite Databricks offering usage tables and internal dashboards, these tools failed to deliver the standardized, business-aligned visibility the FinOps team needed.
What followed was a deeply technical and strategic effort to adopt the FOCUS FinOps cloud cost data format, operationalize ingestion, and unlock cost ownership across teams.
The team realized early on that Databricks’ native system tables (e.g., system.billing.usage, system.billing.list_prices) offered raw billing data, but not in a form aligned with the FOCUS spec. This meant they couldn’t plug cost into their chosen FinOps platform, or track trends across clouds, products, or services.
Internally, frustration mounted:
What made it worse? Each Databricks SKU had different price points based on region, compute type, and deployment model, yet this granularity was invisible to most of the business.
The team began by downloading the FOCUS 1.0 and 1.1 specs. But as they discovered, the schema wasn’t plug-and-play. FOCUS expected 35+ columns such as:
billing_period_start and billing_period_endusage_dateservice_name, usage_type, resource_idcost, currency, regionYet Databricks tables didn’t offer many of these fields directly:
So, they built a translation matrix: Column A was the FOCUS spec, Column B was what Databricks provided, and Column C were derived fields. Everything was documented in GitHub, with inline markdown explaining each SQL transformation and its reasoning.
They used GitHub Copilot to iterate on logic:
By breaking down the FOCUS schema into “consumable bites,” the team built SQL queries that created 100% FOCUS-conformant datasets, including workarounds for fields like sku_id, service_id, and usage granularity.
“We weren’t going to wait for the vendor. We used what they gave us, mapped it to what we needed, and built an ETL layer around it.”, Cloud Cost Architect
Databricks Notebooks became the orchestration layer. The logic was broken down into three distinct stages:
system.billing.usage and list_prices with start_date and end_date filtersservice_name was inferred from origin product fields
Before pushing to the FinOps platform, the team used Databricks' own BI tools to validate the output. They created in-notebook dashboards:
These dashboards weren’t just internal—they were shared across:
This data democratization seeded early buy-in across the business—even before chargeback was implemented.
One sticking point nearly stalled the project: their ingestion platform didn’t accept timestamps with milliseconds. The FOCUS spec implied ISO 8601 compliance—including milliseconds.
A Slack message to the FinOps Foundation community led to:
YYYY-MM-DDTHH:MM:SSZ and proceedThis episode crystallized why FinOps isn’t just a role—it’s a movement. Standards aren’t just documents—they’re relationships, shared knowledge, and collective success.
Curious how leading enterprises fast-track FinOps with zero rework? See how CloudNuro quietly powers success behind the scenes.
What began as a focused technical exercise—transforming Databricks billing into the FOCUS FinOps cloud cost data standard—evolved into a business-wide transformation in cost ownership, trust, and optimization.
By standardizing cost data, automating ingestion, and enabling analysis across teams, this AI-driven enterprise turned cost chaos into clarity—and realized both financial savings and behavioral change.
Before this project, most teams could only see blended DBU spend by environment or account. After implementing the FOCUS pipeline:
The FinOps platform visualizations began showing:
Before: Monthly CSV extracts and manual pivot tables
After: Daily dashboards driving automated alerts and budget actions
“Now when someone asks ‘why did our cloud bill spike?’, we can answer in under 10 minutes—not 10 days.” — Sr. Manager, Cloud Engineering
The team’s primary savings came from behavioral and architectural shifts, not negotiated discounts:
These shifts led to:
The team also gained leverage in procurement discussions—armed with precise per-SKU usage patterns.
Wondering what’s really driving your cloud costs—and how to take control? Explore how CloudNuro uncovers answers your teams can act on.
Once cost data conformed to FOCUS, the FinOps team could apply chargeback or showback policies with confidence. Business units received reports showing:
This transparency reduced tension between engineering and finance. Teams began forecasting compute needs proactively, not reactively.
Finance finally saw unit economics per use case:
“FOCUS gave us a language to talk to the business. It was no longer about raw DBUs—it was about outcomes.” — Director, Enterprise IT Finance
With FOCUS-formatted cost data ingested daily, the FinOps platform could:
This set the stage for:
The CIO began using cloud cost per experiment as a key metric in quarterly reviews.
CloudNuro supports both license-based and usage-based chargeback across SaaS and cloud, with policy-driven allocations and dashboard-ready outputs. - Ready to see a Sample ->
Without FinOps Foundation Slack and GitHub collaboration, this journey might’ve taken 2x longer. The team credits:
Their GitHub repo is now used by multiple organizations looking to transform Databricks usage into FOCUS format—cutting down implementation time for others.
They even received early previews from Databricks confirming native FOCUS export is coming, validating their advocacy efforts.
Near the end of this project, Databricks announced a private preview of native FOCUS-format cost export—something that hadn’t existed when this team began.
Their feedback, code contribution, and user story helped push the vendor to prioritize this feature.
This showcases a broader lesson: when enterprises lead, vendors listen.
This case study reveals more than just a cost transformation—it exposes a repeatable, cross-domain blueprint for adopting the FOCUS FinOps cloud cost data standard. Whether you're working with Databricks, Snowflake, ServiceNow, or any SaaS/IaaS vendor, the same challenges, breakthroughs, and best practices apply.
Let’s unpack the critical learnings every FinOps team, cloud architect, and IT finance leader should take away.
One of the most powerful takeaways: the absence of native FOCUS support is not a blocker.
This team didn’t wait for Databricks to build FOCUS-formatted exports. Instead, they:
By building the bridge themselves, they:
If your FinOps journey is stuck waiting on SaaS providers, you’re not doing FinOps—you’re doing wishful thinking.
Fascinated by how it all connects? Discover how CloudNuro bridges your SaaS and cloud data, out of the box.
The FOCUS format gave this organization a shared language between finance, engineering, and product. No more debates about:
Once FOCUS was in place, dashboards showed normalized costs with consistent columns—regardless of source. This meant:
The result? Less friction, more accountability, and fewer surprises.
Data is powerful—but visualizations drive action.
In this case, pre-FinOps charts were isolated, raw, and unreadable by business stakeholders. Post-FOCUS dashboards revealed:
Dashboards weren’t confined to IT. They were:
Visualization made cloud cost everyone’s problem—and opportunity.
FOCUS helped normalize fields, but insight comes from contextual enrichment.
This team went beyond:
usage_type = "SQL Compute"They added:
team_ownerbusiness_unitenvironmentproject_nameThis metadata was captured at ingestion or joined from other internal systems. It enabled dashboards that answered:
Cloud cost became a unit of business productivity—not just an IT line item.
What if your cost reports spoke your org’s language? See how CloudNuro maps spend to the dimensions that matter—automatically.
ETL—Extract, Transform, Load—might sound technical, but it’s foundational to FinOps success.
This case proves:
By operationalizing the flow, this team ensured:
Every FinOps team should have a data operations playbook—and a team that owns it.
The team’s most unexpected advantage? Slack.
A timestamp formatting issue threatened to derail ingestion. Within an hour, peers from Datadog, Walmart, and the FinOps Foundation clarified the spec and confirmed a simple fix.
This saved:
Community input helped:
Open-source code, shared knowledge, and Slack channels were as critical as cloud tooling. FinOps is not just a discipline—it’s a movement.
“You’re never the only one solving this problem. Ask. Share. Collaborate. That’s how you do FinOps right.”
At the start, Databricks didn’t support FOCUS-formatted exports. The team took two actions:
By the end of the project, Databricks had announced a private preview of FOCUS support—accelerated by community feedback.
Vendors respond to clear, repeated demand. When FinOps practitioners lead, platforms follow.
This case study illustrates what’s possible when an enterprise doesn’t wait for perfection—but builds it. By transforming raw billing exports into standardized, FOCUS-aligned cloud cost data, this AI-first organization achieved:
But most importantly, they unlocked organizational confidence—finance could plan, engineering could optimize, and leadership could measure.
Now imagine doing this not just for Databricks, but across:
That’s what CloudNuro.ai enables.
CloudNuro helps you:
We don’t replace your cloud or SaaS tools—we help you finally understand them.
Want to replicate this transformation?
Book a free FinOps insights demo with CloudNuro.ai to identify waste, enable chargeback, and drive accountability across your tech stack.
This quote underscores the real transformation: FOCUS wasn’t just a data format—it was a trust enabler. It allowed teams across IT, product, and finance to collaborate using the same source of truth.
Ready to shift from reactive firefighting to confident financial strategy? Learn how CloudNuro makes that transition seamless.
This story was originally shared with the FinOps Foundation as part of their enterprise case study series.
Request a no cost, no obligation free assessment - just 15 minutes to savings!
Get StartedWe're offering complimentary ServiceNow license assessments to only 25 enterprises this quarter who want to unlock immediate savings without disrupting operations.
Get Free AssessmentGet Started


CloudNuro Corp
1755 Park St. Suite 207
Naperville, IL 60563
Phone : +1-630-277-9470
Email: info@cloudnuro.com


.webp)

Recognized Leader in SaaS Management Platforms by Info-Tech SoftwareReviews


