Sign Up
What is best time for the call?
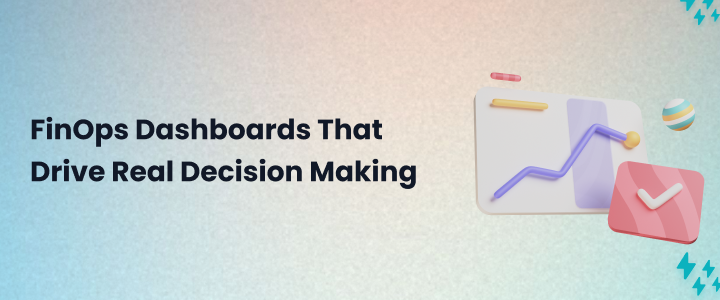
In today’s cloud-first world, financial accountability cannot depend on static reports or spreadsheets. As cloud usage scales across business units, costs become harder to track and even harder to align with business value. That is why FinOps dashboards have become essential. Unlike traditional cloud cost reporting tools, cloud cost dashboards provide real-time visibility, granular insights, and the ability to tie engineering and financial decisions directly to outcomes.
The best FinOps dashboards don’t just display numbers. They drive conversations, enable collaboration, and reveal how each dollar of cloud spend connects to customer value. These cloud financial dashboards transform cost reporting into decision making engines, helping CIOs, CFOs, and engineers work together on a single source of truth.
Dashboards also answer one of the biggest questions facing enterprises today: How do we make cloud spending strategic rather than reactive? By combining real-time usage data with business aligned KPIs, FinOps visualization equips leaders to forecast accurately, allocate budgets intelligently, and avoid costly surprises. Without these dashboards, organizations risk treating cloud spend as an uncontrolled expense rather than a managed investment.
In this blog, we’ll explore what makes dashboards effective, highlight real-world lessons from organizations that have adopted them, and uncover how FinOps dashboards elevate financial governance. By comparing dashboards to traditional reports, we’ll show why decision making in FinOps depends on visualization and why the cloud needs a new model for financial accountability.
Traditional financial reporting was built for predictable IT costs. Reports were often static, generated monthly, and lacked context for engineering. FinOps dashboards, on the other hand, provide continuous, real-time insight into consumption patterns and cost drivers. They replace backward-looking snapshots with forward-looking intelligence, enabling teams to act before the cost spiral.
Key differences between FinOps dashboards and legacy reports:
For finance, cloud cost dashboards provide forecasting accuracy and highlight budget variance against real usage. For engineering, they serve as FinOps visualization tools, showing how design decisions like over provisioning or idle resources affect spend in real time. Executives, meanwhile, use cloud financial dashboards to connect costs with revenue, margins, or customer metrics, ensuring technology investments are clearly tied to business value.
Where static reporting often reinforces silos, FinOps dashboards unify perspectives. They encourage data driven conversations across teams by presenting a single version of the truth. Instead of finance engineers chasing overruns or executives struggling with high level summaries, dashboards create transparency that drives accountability. By offering shared visibility, they turn financial management from reactive cost control into a proactive, collaborative discipline that delivers measurable business value.
Most dashboards show numbers, but few drive accountability. CloudNuro transforms FinOps dashboards into decision making tools by combining real-time cloud cost data with automated chargeback and unit economics, giving every team clear ownership of spend.
The best FinOps dashboards combine multiple perspectives to serve both finance and engineering teams. To move beyond visibility and drive real decision making, dashboards must include these core elements:
1. Spend by Business Unit or Product
A powerful cloud cost dashboard breaks spend down by business unit, product, or cost center. This level of granularity ensures teams see exactly what portion of the bill belongs to them. When costs are lumped together, accountability vanishes. By visualizing spend at the unit level, finance can allocate budgets fairly, engineering teams understand their financial impact, and leaders can compare efficiency across lines of business. This transparency also makes chargeback or showback models easier to implement, turning costs into shared responsibility instead of abstract overhead.
Key advantages:
2. Unit Economics
FinOps dashboards become meaningful when they connect cloud spend to business outcomes. Tracking unit economics, such as cost per transaction, per customer, or per feature, translates raw spend into performance metrics. For example, a spike in infrastructure costs may be acceptable if it supports a surge in new customers. Conversely, rising spend without matching growth signals inefficiency. By embedding unit economics, cloud financial dashboards enable executives to ask better questions: Is this service profitable? Are we scaling efficiently? Unit metrics transform dashboards into strategic tools rather than expense trackers.
Key advantages:
3. Anomaly Detection and Alerts
Without automation, teams often discover overspending too late, usually when invoices arrive. Effective cloud cost dashboards integrate anomaly detection, flagging sudden spikes or unusual patterns in near real time. Alerts sent to both finance and engineering prevent runaway costs and trigger quick investigation. For example, if a misconfigured workload doubles computer spend overnight, anomaly detection ensures the problem is caught before it snowballs. This proactive capability shifts FinOps from reactive cost cutting to preventive governance, building trust in the system while protecting budgets and margins.
Key advantages:
4. Forecast vs Actual Spend
Static budgets often collapse under the variability of the cloud. FinOps dashboards that compare forecasted spend against actual usage highlight variances early and allow teams to refine models. This visibility builds confidence for finance, while giving engineers a feedback loop to align resource use with budgets. Over time, forecast accuracy improves, making it easier for leadership to plan investments and manage profitability. Dashboards that embed forecast vs actual also reduce the dreaded “end of month invoice shock” by turning uncertainty into predictable, explainable trends.
Key advantages:
5. Optimization Opportunities
Beyond tracking spend, the best cloud cost reporting tools surface opportunities to optimize. Dashboards should highlight unused resources, rightsizing potential, or commitment shortfalls. This guidance empowers engineering teams to take action without waiting for finance to push cuts. For instance, surfacing idle storage volumes or underutilized reserved instances provides direct savings without impacting performance. When optimization insights are embedded into FinOps visualization, dashboards become more than monitoring tools. They become action-oriented engines for efficiency and growth.
Key advantages:
A fast-growing SaaS provider was scaling quickly across multiple regions. While revenue grew steadily, cloud bills grew even faster, and tensions mounted between finance and engineering. Finance teams relied on manual spreadsheets, while engineers lacked visibility into how their design choices affected spend. As a result, both sides operated in silos, and executives were left with little confidence in forecasts.
It is a common problem when organizations rely on outdated cloud cost reporting tools instead of modern FinOps dashboards. Without shared visibility, finance focused only on budget overruns, while engineers prioritized feature velocity without considering financial impact. The lack of alignment created surprises at the end of each month and eroded trust across departments.
How the SaaS Provider Responded
To resolve the issue, the company implemented cloud cost dashboards as part of a broader FinOps initiative. Their goal was not only to visualize costs but also to enable better decision making across finance, engineering, and executive teams.
They took three deliberate steps:
Outcomes Achieved
Within six months, the provider saw measurable improvements:
Lessons Learned
The SaaS provider’s experience reveals an important truth: FinOps dashboards are not just cost trackers; they are cultural enablers. When built thoughtfully, dashboards bridge the gap between finance and engineering, creating a single source of truth that drives alignment and accountability. The shift from spreadsheets to real-time cloud cost dashboards reshaped how teams worked together and how leaders made decisions.
Key lessons include:
Ultimately, the lesson is clear: the best FinOps dashboards don’t just report the past, they guide the future.
The SaaS provider’s transformation shows how FinOps dashboards can turn cost reporting into real collaboration. CloudNuro makes this shift practical by unifying cloud and SaaS spend into decision ready dashboards that finance, engineering, and executives can all trust.
Even with the right intentions, many organizations fail to make their FinOps dashboards actionable. Mistakes in design or execution often led to underutilized tools, siloed insights, and lost opportunities for decision making. Here are the most common pitfalls:
1. Data Without Context
Raw cost data without business alignment leaves stakeholders confused. Simply showing monthly spend by service does not help executives decide where to invest. FinOps dashboards must link costs to unit economics, such as cost per customer or cost per feature, to make numbers meaningful. Without this translation, dashboards remain numbers on a screen instead of decision-making engines. Finance leaders cannot use them to justify budgets, engineers don’t see the impact of their work, and executives are left questioning the value of cloud spend.
Why this fails:
2. Siloed Access
A dashboard used only by finance is just another reporting tool. Effective cloud cost dashboards must be shared across finance, engineering, and product teams to foster collaboration. Without transparency, dashboards reinforce silos instead of breaking them down. When engineers don’t see costs, they can’t optimize workloads. When finance doesn’t understand engineering tradeoffs, they make unrealistic demands. And when executives only see summaries, they can’t drill down into the real drivers of cost. Open access ensures dashboards become a shared source of truth rather than a gatekeeping mechanism.
Signs of siloed dashboards:
3. Over-Reliance on Tools
Tools alone do not solve financial accountability. Many companies implement cloud cost reporting tools but fail to embed them into workflows. Without process changes, dashboards become static reports instead of decision engines. A platform may surface anomalies, but if no team is responsible for action, waste continues. Similarly, dashboards may show optimization opportunities, but without engineers incentivized to act, the data remains unused. The real value of dashboards comes when they are integrated into daily rituals like sprint reviews and planning cycles.
Avoid this by:
4. Over-Complication
Dashboards overloaded with dozens of KPIs overwhelm users. Adoption drops when stakeholders cannot quickly interpret the data. The most effective FinOps dashboards focus on a handful of actionable metrics. Too much detail creates noise and undermines trust. Users start ignoring dashboards that feel cluttered or inconsistent. Instead, leaders should design dashboards with clarity in mind: highlight trends, show key variances, and surface top optimization opportunities. Simplicity drives daily use, which is what ultimately changes behavior. Dashboards should empower teams, not confuse them.
Why simplicity works:
Many teams fall into these pitfalls with too much data, siloed access, or dashboards that don’t drive action.
CloudNuro helps avoid these mistakes by delivering FinOps dashboards that combine simplicity, real-time insights, and shared accountability, so finance, engineering, and leadership all make decisions from the same source of truth.
One of the most potent aspects of FinOps dashboards is their ability to turn complex cost data into insights that drive real business decisions. Raw numbers in spreadsheets may be accurate, but they often lack meaning for engineers, product leaders, or executives who need to act on them. By transforming spend data into clear visualizations, such as charts, heatmaps, variance lines, or KPI-based scorecards, cloud cost dashboards make information understandable and actionable across the enterprise.
FinOps visualization matters because it bridges three different worlds. Finance wants predictability and accurate forecasting. Engineering wants agility and flexibility to innovate without constraints. Executives want assurance that cloud investments are delivering measurable returns. A well-designed cloud financial dashboard provides a shared language for all three, ensuring every stakeholder can see costs in context and make faster, better aligned decisions.
Key benefits of visualization in FinOps:
The impact of FinOps dashboards is not just operational but cultural. Engineers who see their team’s cost footprint daily learn to treat financial accountability as part of performance quality. Finance teams build confidence in forecasts because variances are tracked and visible continuously. Executives gain visibility into how spend maps to revenue, margins, or customer value, ensuring technology is always tied to outcomes.
In short, visualization elevates FinOps from accounting to strategy. Cloud cost dashboards don’t just explain where money was spent; they guide where it should be spent next, making them essential for decision making in modern enterprises.
Visualization only drives action when it unites all perspectives, such as finance, engineering, and leadership. CloudNuro delivers FinOps dashboards that combine SaaS and cloud cost data in one view, giving every stakeholder the context they need to make decisions with confidence.
1. What are FinOps dashboards, and why are they important?
FinOps dashboards are cloud cost dashboards designed to give real-time visibility into cloud and SaaS spend. Unlike static spreadsheets, they provide interactive visualizations that highlight trends, anomalies, and unit economics. They are essential because they turn cost data into decision ready insights for finance, engineering, and executives. With clear visibility, organizations can align on budgets, reduce waste, and connect cloud investments directly to business outcomes.
2. How do FinOps dashboards differ from traditional cloud cost reporting tools?
Traditional cloud cost reporting tools usually generate static monthly reports that lack context for engineers and product teams. FinOps dashboards are dynamic, continuously updated, and tailored for cross-functional use. They go beyond tracking spend to show cost per customer, per transaction, or per feature, which allows leaders to measure efficiency and profitability. In short, reporting tools show what happened, while FinOps dashboards show what’s happening now and what to do next.
3. What KPIs should be included in cloud financial dashboards?
The most effective cloud financial dashboards include KPIs that link spend to business value. Core metrics include:
4. How do FinOps dashboards support decision making?
FinOps visualization supports decision making by turning complex usage data into clear, understandable insights. Finance uses dashboards to improve forecasting and manage budgets. Engineers see how their design choices impact spend and take ownership of optimization. Executives connect costs to revenue and margins, ensuring technology investments align with business priorities. By unifying all perspectives, dashboards reduce conflicts, speed up decisions, and create a shared accountability culture across the organization.
5. Can FinOps dashboards help reduce cloud costs?
Yes. The best FinOps dashboards surface optimization opportunities directly in the interface. For example, they may flag idle storage volumes, underutilized instances, or overprovisioned workloads. They also highlight unit economics, which helps leaders decide whether a product or service is scaling efficiently. By making costs transparent to engineering teams, dashboards encourage proactive rightsizing and better resource management, leading to measurable reductions in cloud waste.
6. Who benefits most from FinOps dashboards?
Everyone involved in cloud financial governance benefits. Finance teams gain more accurate forecasts and better cost allocation models. Engineers gain visibility into their usage footprint, making them accountable for optimization. Executives gain confidence that technology spend supports growth and profitability. In short, FinOps dashboards democratize cost data so that every stakeholder, from CFO to developer, can make informed decisions that align with business outcomes.
Conclusion: Turning Dashboards into Decisions
The difference between static cost reports and FinOps dashboards is the difference between hindsight and foresight. Dashboards turn cloud cost data into insights that finance, engineering, and executives can all act on. By combining real-time visibility, anomaly detection, forecasting, and unit economics, cloud financial dashboards create a single source of truth for the entire organization.
The organizations that succeed with FinOps treat dashboards not as reporting tools, but as decision engines. They link spend directly to business outcomes, empower engineers to own their costs, and give executives confidence that cloud investments align with growth. In short, FinOps visualization shifts financial management from reactive firefighting to proactive strategy, making it a cornerstone of modern cloud governance.
Before adopting FinOps dashboards, we relied heavily on static reports that always came too late to act on. Teams argued over numbers, and finance was constantly chasing overruns. Once we moved to decision ready dashboards, everything changed. Engineers could see the cost impact of their work daily, finance gained confidence in forecasts, and leadership finally connected spend to outcomes. It turned cloud costs from a problem into a shared responsibility across the company.
For finance, this means forecasts they can trust. For engineering, it embeds financial accountability into daily workflows without slowing innovation. For executives, it connects technology investments directly to margins and growth.
CloudNuro’s approach ensures dashboards don’t sit idle as reporting tools. They become cultural drivers, enabling collaboration, guiding smarter decisions, and proving the business value of every cloud dollar.
👉 If your dashboards aren’t driving action, it may be time to rethink your approach. Book a free FinOps insights walkthrough and see how CloudNuro can transform dashboards into a decision-making engine that delivers measurable results.
Request a no cost, no obligation free assessment —just 15 minutes to savings!
Get StartedIn today’s cloud-first world, financial accountability cannot depend on static reports or spreadsheets. As cloud usage scales across business units, costs become harder to track and even harder to align with business value. That is why FinOps dashboards have become essential. Unlike traditional cloud cost reporting tools, cloud cost dashboards provide real-time visibility, granular insights, and the ability to tie engineering and financial decisions directly to outcomes.
The best FinOps dashboards don’t just display numbers. They drive conversations, enable collaboration, and reveal how each dollar of cloud spend connects to customer value. These cloud financial dashboards transform cost reporting into decision making engines, helping CIOs, CFOs, and engineers work together on a single source of truth.
Dashboards also answer one of the biggest questions facing enterprises today: How do we make cloud spending strategic rather than reactive? By combining real-time usage data with business aligned KPIs, FinOps visualization equips leaders to forecast accurately, allocate budgets intelligently, and avoid costly surprises. Without these dashboards, organizations risk treating cloud spend as an uncontrolled expense rather than a managed investment.
In this blog, we’ll explore what makes dashboards effective, highlight real-world lessons from organizations that have adopted them, and uncover how FinOps dashboards elevate financial governance. By comparing dashboards to traditional reports, we’ll show why decision making in FinOps depends on visualization and why the cloud needs a new model for financial accountability.
Traditional financial reporting was built for predictable IT costs. Reports were often static, generated monthly, and lacked context for engineering. FinOps dashboards, on the other hand, provide continuous, real-time insight into consumption patterns and cost drivers. They replace backward-looking snapshots with forward-looking intelligence, enabling teams to act before the cost spiral.
Key differences between FinOps dashboards and legacy reports:
For finance, cloud cost dashboards provide forecasting accuracy and highlight budget variance against real usage. For engineering, they serve as FinOps visualization tools, showing how design decisions like over provisioning or idle resources affect spend in real time. Executives, meanwhile, use cloud financial dashboards to connect costs with revenue, margins, or customer metrics, ensuring technology investments are clearly tied to business value.
Where static reporting often reinforces silos, FinOps dashboards unify perspectives. They encourage data driven conversations across teams by presenting a single version of the truth. Instead of finance engineers chasing overruns or executives struggling with high level summaries, dashboards create transparency that drives accountability. By offering shared visibility, they turn financial management from reactive cost control into a proactive, collaborative discipline that delivers measurable business value.
Most dashboards show numbers, but few drive accountability. CloudNuro transforms FinOps dashboards into decision making tools by combining real-time cloud cost data with automated chargeback and unit economics, giving every team clear ownership of spend.
The best FinOps dashboards combine multiple perspectives to serve both finance and engineering teams. To move beyond visibility and drive real decision making, dashboards must include these core elements:
1. Spend by Business Unit or Product
A powerful cloud cost dashboard breaks spend down by business unit, product, or cost center. This level of granularity ensures teams see exactly what portion of the bill belongs to them. When costs are lumped together, accountability vanishes. By visualizing spend at the unit level, finance can allocate budgets fairly, engineering teams understand their financial impact, and leaders can compare efficiency across lines of business. This transparency also makes chargeback or showback models easier to implement, turning costs into shared responsibility instead of abstract overhead.
Key advantages:
2. Unit Economics
FinOps dashboards become meaningful when they connect cloud spend to business outcomes. Tracking unit economics, such as cost per transaction, per customer, or per feature, translates raw spend into performance metrics. For example, a spike in infrastructure costs may be acceptable if it supports a surge in new customers. Conversely, rising spend without matching growth signals inefficiency. By embedding unit economics, cloud financial dashboards enable executives to ask better questions: Is this service profitable? Are we scaling efficiently? Unit metrics transform dashboards into strategic tools rather than expense trackers.
Key advantages:
3. Anomaly Detection and Alerts
Without automation, teams often discover overspending too late, usually when invoices arrive. Effective cloud cost dashboards integrate anomaly detection, flagging sudden spikes or unusual patterns in near real time. Alerts sent to both finance and engineering prevent runaway costs and trigger quick investigation. For example, if a misconfigured workload doubles computer spend overnight, anomaly detection ensures the problem is caught before it snowballs. This proactive capability shifts FinOps from reactive cost cutting to preventive governance, building trust in the system while protecting budgets and margins.
Key advantages:
4. Forecast vs Actual Spend
Static budgets often collapse under the variability of the cloud. FinOps dashboards that compare forecasted spend against actual usage highlight variances early and allow teams to refine models. This visibility builds confidence for finance, while giving engineers a feedback loop to align resource use with budgets. Over time, forecast accuracy improves, making it easier for leadership to plan investments and manage profitability. Dashboards that embed forecast vs actual also reduce the dreaded “end of month invoice shock” by turning uncertainty into predictable, explainable trends.
Key advantages:
5. Optimization Opportunities
Beyond tracking spend, the best cloud cost reporting tools surface opportunities to optimize. Dashboards should highlight unused resources, rightsizing potential, or commitment shortfalls. This guidance empowers engineering teams to take action without waiting for finance to push cuts. For instance, surfacing idle storage volumes or underutilized reserved instances provides direct savings without impacting performance. When optimization insights are embedded into FinOps visualization, dashboards become more than monitoring tools. They become action-oriented engines for efficiency and growth.
Key advantages:
A fast-growing SaaS provider was scaling quickly across multiple regions. While revenue grew steadily, cloud bills grew even faster, and tensions mounted between finance and engineering. Finance teams relied on manual spreadsheets, while engineers lacked visibility into how their design choices affected spend. As a result, both sides operated in silos, and executives were left with little confidence in forecasts.
It is a common problem when organizations rely on outdated cloud cost reporting tools instead of modern FinOps dashboards. Without shared visibility, finance focused only on budget overruns, while engineers prioritized feature velocity without considering financial impact. The lack of alignment created surprises at the end of each month and eroded trust across departments.
How the SaaS Provider Responded
To resolve the issue, the company implemented cloud cost dashboards as part of a broader FinOps initiative. Their goal was not only to visualize costs but also to enable better decision making across finance, engineering, and executive teams.
They took three deliberate steps:
Outcomes Achieved
Within six months, the provider saw measurable improvements:
Lessons Learned
The SaaS provider’s experience reveals an important truth: FinOps dashboards are not just cost trackers; they are cultural enablers. When built thoughtfully, dashboards bridge the gap between finance and engineering, creating a single source of truth that drives alignment and accountability. The shift from spreadsheets to real-time cloud cost dashboards reshaped how teams worked together and how leaders made decisions.
Key lessons include:
Ultimately, the lesson is clear: the best FinOps dashboards don’t just report the past, they guide the future.
The SaaS provider’s transformation shows how FinOps dashboards can turn cost reporting into real collaboration. CloudNuro makes this shift practical by unifying cloud and SaaS spend into decision ready dashboards that finance, engineering, and executives can all trust.
Even with the right intentions, many organizations fail to make their FinOps dashboards actionable. Mistakes in design or execution often led to underutilized tools, siloed insights, and lost opportunities for decision making. Here are the most common pitfalls:
1. Data Without Context
Raw cost data without business alignment leaves stakeholders confused. Simply showing monthly spend by service does not help executives decide where to invest. FinOps dashboards must link costs to unit economics, such as cost per customer or cost per feature, to make numbers meaningful. Without this translation, dashboards remain numbers on a screen instead of decision-making engines. Finance leaders cannot use them to justify budgets, engineers don’t see the impact of their work, and executives are left questioning the value of cloud spend.
Why this fails:
2. Siloed Access
A dashboard used only by finance is just another reporting tool. Effective cloud cost dashboards must be shared across finance, engineering, and product teams to foster collaboration. Without transparency, dashboards reinforce silos instead of breaking them down. When engineers don’t see costs, they can’t optimize workloads. When finance doesn’t understand engineering tradeoffs, they make unrealistic demands. And when executives only see summaries, they can’t drill down into the real drivers of cost. Open access ensures dashboards become a shared source of truth rather than a gatekeeping mechanism.
Signs of siloed dashboards:
3. Over-Reliance on Tools
Tools alone do not solve financial accountability. Many companies implement cloud cost reporting tools but fail to embed them into workflows. Without process changes, dashboards become static reports instead of decision engines. A platform may surface anomalies, but if no team is responsible for action, waste continues. Similarly, dashboards may show optimization opportunities, but without engineers incentivized to act, the data remains unused. The real value of dashboards comes when they are integrated into daily rituals like sprint reviews and planning cycles.
Avoid this by:
4. Over-Complication
Dashboards overloaded with dozens of KPIs overwhelm users. Adoption drops when stakeholders cannot quickly interpret the data. The most effective FinOps dashboards focus on a handful of actionable metrics. Too much detail creates noise and undermines trust. Users start ignoring dashboards that feel cluttered or inconsistent. Instead, leaders should design dashboards with clarity in mind: highlight trends, show key variances, and surface top optimization opportunities. Simplicity drives daily use, which is what ultimately changes behavior. Dashboards should empower teams, not confuse them.
Why simplicity works:
Many teams fall into these pitfalls with too much data, siloed access, or dashboards that don’t drive action.
CloudNuro helps avoid these mistakes by delivering FinOps dashboards that combine simplicity, real-time insights, and shared accountability, so finance, engineering, and leadership all make decisions from the same source of truth.
One of the most potent aspects of FinOps dashboards is their ability to turn complex cost data into insights that drive real business decisions. Raw numbers in spreadsheets may be accurate, but they often lack meaning for engineers, product leaders, or executives who need to act on them. By transforming spend data into clear visualizations, such as charts, heatmaps, variance lines, or KPI-based scorecards, cloud cost dashboards make information understandable and actionable across the enterprise.
FinOps visualization matters because it bridges three different worlds. Finance wants predictability and accurate forecasting. Engineering wants agility and flexibility to innovate without constraints. Executives want assurance that cloud investments are delivering measurable returns. A well-designed cloud financial dashboard provides a shared language for all three, ensuring every stakeholder can see costs in context and make faster, better aligned decisions.
Key benefits of visualization in FinOps:
The impact of FinOps dashboards is not just operational but cultural. Engineers who see their team’s cost footprint daily learn to treat financial accountability as part of performance quality. Finance teams build confidence in forecasts because variances are tracked and visible continuously. Executives gain visibility into how spend maps to revenue, margins, or customer value, ensuring technology is always tied to outcomes.
In short, visualization elevates FinOps from accounting to strategy. Cloud cost dashboards don’t just explain where money was spent; they guide where it should be spent next, making them essential for decision making in modern enterprises.
Visualization only drives action when it unites all perspectives, such as finance, engineering, and leadership. CloudNuro delivers FinOps dashboards that combine SaaS and cloud cost data in one view, giving every stakeholder the context they need to make decisions with confidence.
1. What are FinOps dashboards, and why are they important?
FinOps dashboards are cloud cost dashboards designed to give real-time visibility into cloud and SaaS spend. Unlike static spreadsheets, they provide interactive visualizations that highlight trends, anomalies, and unit economics. They are essential because they turn cost data into decision ready insights for finance, engineering, and executives. With clear visibility, organizations can align on budgets, reduce waste, and connect cloud investments directly to business outcomes.
2. How do FinOps dashboards differ from traditional cloud cost reporting tools?
Traditional cloud cost reporting tools usually generate static monthly reports that lack context for engineers and product teams. FinOps dashboards are dynamic, continuously updated, and tailored for cross-functional use. They go beyond tracking spend to show cost per customer, per transaction, or per feature, which allows leaders to measure efficiency and profitability. In short, reporting tools show what happened, while FinOps dashboards show what’s happening now and what to do next.
3. What KPIs should be included in cloud financial dashboards?
The most effective cloud financial dashboards include KPIs that link spend to business value. Core metrics include:
4. How do FinOps dashboards support decision making?
FinOps visualization supports decision making by turning complex usage data into clear, understandable insights. Finance uses dashboards to improve forecasting and manage budgets. Engineers see how their design choices impact spend and take ownership of optimization. Executives connect costs to revenue and margins, ensuring technology investments align with business priorities. By unifying all perspectives, dashboards reduce conflicts, speed up decisions, and create a shared accountability culture across the organization.
5. Can FinOps dashboards help reduce cloud costs?
Yes. The best FinOps dashboards surface optimization opportunities directly in the interface. For example, they may flag idle storage volumes, underutilized instances, or overprovisioned workloads. They also highlight unit economics, which helps leaders decide whether a product or service is scaling efficiently. By making costs transparent to engineering teams, dashboards encourage proactive rightsizing and better resource management, leading to measurable reductions in cloud waste.
6. Who benefits most from FinOps dashboards?
Everyone involved in cloud financial governance benefits. Finance teams gain more accurate forecasts and better cost allocation models. Engineers gain visibility into their usage footprint, making them accountable for optimization. Executives gain confidence that technology spend supports growth and profitability. In short, FinOps dashboards democratize cost data so that every stakeholder, from CFO to developer, can make informed decisions that align with business outcomes.
Conclusion: Turning Dashboards into Decisions
The difference between static cost reports and FinOps dashboards is the difference between hindsight and foresight. Dashboards turn cloud cost data into insights that finance, engineering, and executives can all act on. By combining real-time visibility, anomaly detection, forecasting, and unit economics, cloud financial dashboards create a single source of truth for the entire organization.
The organizations that succeed with FinOps treat dashboards not as reporting tools, but as decision engines. They link spend directly to business outcomes, empower engineers to own their costs, and give executives confidence that cloud investments align with growth. In short, FinOps visualization shifts financial management from reactive firefighting to proactive strategy, making it a cornerstone of modern cloud governance.
Before adopting FinOps dashboards, we relied heavily on static reports that always came too late to act on. Teams argued over numbers, and finance was constantly chasing overruns. Once we moved to decision ready dashboards, everything changed. Engineers could see the cost impact of their work daily, finance gained confidence in forecasts, and leadership finally connected spend to outcomes. It turned cloud costs from a problem into a shared responsibility across the company.
For finance, this means forecasts they can trust. For engineering, it embeds financial accountability into daily workflows without slowing innovation. For executives, it connects technology investments directly to margins and growth.
CloudNuro’s approach ensures dashboards don’t sit idle as reporting tools. They become cultural drivers, enabling collaboration, guiding smarter decisions, and proving the business value of every cloud dollar.
👉 If your dashboards aren’t driving action, it may be time to rethink your approach. Book a free FinOps insights walkthrough and see how CloudNuro can transform dashboards into a decision-making engine that delivers measurable results.
Request a no cost, no obligation free assessment - just 15 minutes to savings!
Get StartedWe're offering complimentary ServiceNow license assessments to only 25 enterprises this quarter who want to unlock immediate savings without disrupting operations.
Get Free AssessmentGet Started


CloudNuro Corp
1755 Park St. Suite 207
Naperville, IL 60563
Phone : +1-630-277-9470
Email: info@cloudnuro.com


.webp)

Recognized Leader in SaaS Management Platforms by Info-Tech SoftwareReviews