Sign Up
Thank you for Submitting!

Figma has quickly become the backbone of digital product teams, supporting wireframing, prototyping, design systems, and cross-functional collaboration across product, engineering, research, marketing, and customer experience teams.
As Figma adoption grows, license counts expand across the organization, quietly increasing costs in ways most teams do not anticipate.
The majority of companies overpay for Figma not because they intentionally waste money, but because the pricing model naturally encourages seat expansion through mechanisms like auto-upgrades.
Auto-upgrades silently convert users from free Viewer seats to paid Editor seats, guests become billable without warning, teams create multiple workspaces with duplicate seats, and design system sprawl increases editing requirements.
Organizations also continue paying for seats belonging to inactive or departed users due to weak offboarding practices.
If your Figma invoice grows year over year without clear visibility into why, you are not alone, as overspending is extremely common in environments optimized for collaboration rather than cost control.
This blog provides a complete cost analysis of where organizations waste money inside Figma, how to detect overspending, and the actionable steps you can take to fix it without slowing down design velocity.
Choosing the right plan is critical, as access may vary depending on the selected plan and seats can include Figma products such as FigJam, Figma Slides, Dev Mode, Figma Design, Figma Draw, Figma Buzz, Figma Sites, and Figma Make.
Most companies do not notice Figma overspending until renewal season or when finance questions a sudden spike in SaaS expenditure.
The following warning signs indicate that you are likely spending more than necessary on Figma.
Your Editor count continues to increase month after month while design output remains steady.
This pattern is almost always caused by a handful of common issues.
Many organizations discover that a large portion of Editors rarely or never perform genuine editing work.
Instead, their behavior looks more like that of Viewers or Commenters.
These users generally do not need paid Editor seats.
Figma is rarely integrated into standard offboarding workflows, leading to lingering access and license waste.
As a result, multiple categories of users continue consuming paid licenses after they should have been removed.
Teams frequently create new Figma workspaces without informing IT or centralized admins.
This fragmented setup introduces several layers of hidden cost.
Large design and product teams often over-assign FigJam Editor seats.
In many cases, users only need free FigJam Guest access for basic collaboration.
Figma invoices can spike unexpectedly due to several usage and billing events.
If any of these patterns sound familiar, overspending is already happening.
This rapid checklist helps you gauge how much Figma overspending risk your organization carries.
If you checked four or more of these items, overspending is likely significant.
Figma overspending usually stems from a combination of structural, behavioral, and governance issues.
The sections below break down the most significant contributors to wasted spend.
One of the most expensive and least known features of Figma is auto-upgrading.
When a Viewer performs editing actions, they automatically convert to a paid Editor without requiring confirmation or notifying the admin, and the change appears directly on your invoice.
Common triggers include:
This is where many organizations lose 10 to 25 percent of their Figma budget.
Inactive seats are the number one form of Figma license waste.
CloudNuro analysis across dozens of enterprises shows trends that dramatically impact spend.
These seats accumulate silently and typically renew annually unless manually removed.
When multiple workspaces exist, a single user may end up with multiple paid seats.
This pattern is especially common in large organizations.
Duplication like this can lead to exponential spend growth.
Figma is often overlooked during user offboarding, especially for contractors and agency staff.
This oversight creates both cost and security risks.
FigJam Editor licenses cost money, but many users only require free Guest functionality.
Common unnecessary FigJam Editor assignments include:
These users rarely need the full capabilities of paid FigJam seats.
The following steps help uncover Figma overspending patterns quickly so you can take immediate corrective action.
Start by extracting recent activity data for all Figma users.
Look for the following indicators:
Users with no editing actions should be prime candidates for downgrade.
Next, use the activity report to flag inactive users over defined time windows.
These users should be downgraded or removed entirely.
Analyze your Figma workspace structure to find redundancy and fragmentation.
Consolidating workspaces reduces seat duplication and improves governance.
Guest access can accumulate over time as projects are completed and collaborators move on.
Remove the following categories of guests:
Investigate how and why Viewers are converting to Editors.
Evaluate how FigJam Editors actually use the product.
CloudNuro provides data-driven recommendations to eliminate Figma waste without slowing down your design teams.
Organizations commonly reduce Figma spend by 20 to 40 percent while maintaining or improving design velocity.
Book your Figma Optimization Assessment today.
The following scenarios are practical examples observed across mid-market and enterprise organizations using Figma.
A product team of 40 people had 28 Editor seats even though they never edited designs, instead only reviewing prototypes and commenting on flows.
After downgrading these users, the organization achieved savings of 22,000 USD per year.
Engineering teams frequently inspect designs but rarely modify them.
In one company, 75 engineers held Editor seats, and reassigning them to Viewer roles resulted in a 78 percent reduction in those license costs.
A design agency completed its engagement but retained Editor seats for six additional months.
Removing these seats generated savings of 17,000 USD.
A large enterprise operated with multiple overlapping workspaces.
Many users were billed across all nine workspaces, and consolidating them delivered savings of 120,000 USD.
One organization maintained 250 FigJam Editors, but usage data showed that advanced FigJam features were only used by a small subset of users.
By downgrading unnecessary FigJam Editors, they realized savings of over 40,000 USD.
The following actions can reduce your Figma spending within a week if executed decisively.
Impact: 15 to 25 percent savings on Figma licenses.
Systematically downgrade users who do not need full editing capabilities.
Impact: 10 to 20 percent savings.
Audit and clean up guest users to close out unnecessary access.
Impact: 5 to 10 percent savings.
Merge workspaces and centralize billing across major functions.
Impact: 10 to 15 percent savings.
Implement file and library retention rules to reduce clutter and accidental edits.
Impact: 5 to 8 percent reduction in noise and accidental editing.
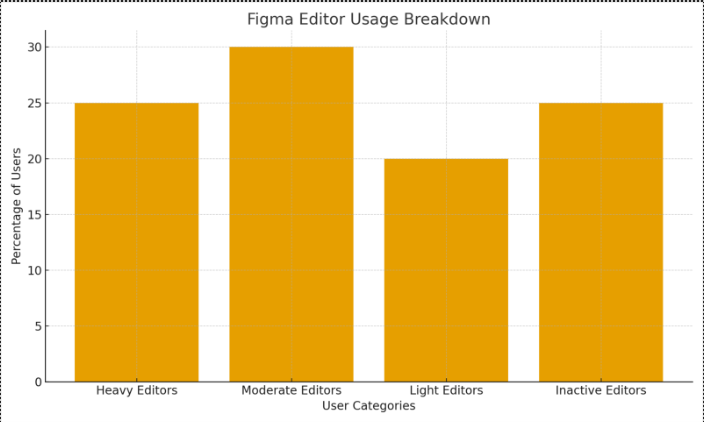
This graph illustrates Figma Editor activity levels across the organization, segmented into the following categories.
The bar chart shows four categories of Figma usage by share of Editor seats.
This breakdown reveals which users truly need paid Editor seats and which can be safely downgraded or removed.
Users in the following categories represent a major opportunity for cost reduction.
Together, these groups account for 45 percent of the total Editor base.
Optimization Recommendation:
Impact: A direct 25 to 45 percent reduction in Editor seat costs.
Moderate Editors may not need full editing privileges daily, and they are at risk of triggering unnecessary upgrades over time.
Ask questions such as:
Optimization Recommendation:
Impact: Prevention of future unwanted Editor upgrades.
Heavy Editors, who make up around 25 percent of users, are actively engaged in design work and should retain Editor access.
Use graph insight to:
Impact: Improved design productivity without cutting essential seats.
The graph visually demonstrates that more than 45 percent of Editors deliver low or no value.
This visualization supports conversations around cost optimization and governance.
Impact: Clear justification to reduce spend or downgrade seats.
Using the same logic, you can build a recurring optimization playbook to maintain Figma cost control over time.
Impact: Sustained long-term cost control and prevention of wasteful seat creep.
Most companies pay for Editors who do not actually edit, and CloudNuro automates the process of identifying and downgrading these wasteful seats.
The insights and visuals described here can be repurposed across multiple channels.
Consider an example where your organization has 100 Editor seats.
Expected Reduction: 55 to 65 seats total.
If each Editor costs 45 USD per month on the Organization plan, then 65 seats saved × 45 USD × 12 months equals:
If Inactive and Light Editors reappear each quarter, you can model future waste and justify continuous governance or automation through CloudNuro.
This enables more accurate forecasts and proactive Figma budget planning.
| Category | Action | Impact |
|---|---|---|
| Heavy Editors | Keep seats | Maintain productivity |
| Moderate Editors | Audit and limit | Prevent auto upgrades |
| Light Editors | Downgrade | Save 10–20 percent |
| Inactive Editors | Remove | Save 20–25 percent |
Total Optimization Potential:
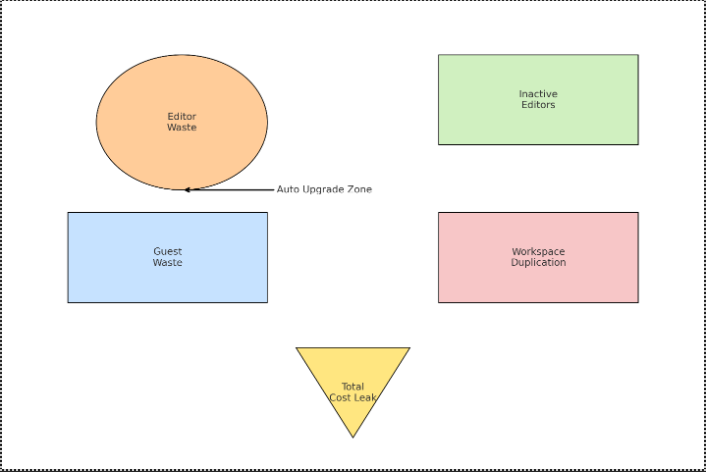
This visual concept highlights the key areas where Figma costs leak inside organizations.
Establishing governance practices around Figma usage and licensing is essential for long-term cost control.
Review Editor assignments at least every 90 days and adjust roles based on actual usage.
Integrate Figma with your HRIS system so that user offboarding automatically revokes Figma access.
Limit workspace creation rights to DesignOps or IT to prevent uncontrolled proliferation.
Lock key files to protect against accidental edits that trigger auto-upgrades from Viewer to Editor.
Define a clear mapping between roles and Figma access levels to enforce consistency.
Monitor FigJam usage and avoid upgrading users to Editors unless their activity justifies it.
Figma overspending is widespread because teams naturally adopt the tool for every stage of product design and collaboration.
While this accelerates delivery, it also increases license consumption when left unmonitored, leading to significant and often hidden costs.
By detecting inactive licenses, analyzing user behavior, rightsizing roles, cleaning up workspaces, optimizing FigJam, and introducing governance, organizations can reduce Figma spend by 20 to 40 percent within weeks.
CloudNuro addresses one of the most significant SaaS challenges: lack of visibility into license usage and cost drivers.
With automated monitoring, usage analysis, and actionable optimization recommendations, CloudNuro helps ensure you never pay for unused Figma licenses again.
CloudNuro is a leader in Enterprise SaaS Management Platforms, giving enterprises unmatched visibility, governance, and cost optimization.
Recognized twice in a row by Gartner in the SaaS Management Platforms Magic Quadrant and named a Leader in the Info-Tech SoftwareReviews Data Quadrant, CloudNuro is trusted by global enterprises and government agencies to bring financial discipline to SaaS and cloud.
Trusted by enterprises such as Konica Minolta and Federal Signal, the solution provides centralized SaaS inventory, license optimization, and renewal management, along with advanced cost allocation and chargeback.
This gives IT and Finance leaders the visibility, control, and cost-conscious culture needed to drive financial discipline.
As the only FinOps-certified Enterprise SaaS Management Platform, CloudNuro unifies SaaS and IaaS management in a single view.
With a 15-minute setup and measurable results in under 24 hours, CloudNuro gives IT teams a fast path to value.
Request a no cost, no obligation free assessment —just 15 minutes to savings!
Get StartedFigma has quickly become the backbone of digital product teams, supporting wireframing, prototyping, design systems, and cross-functional collaboration across product, engineering, research, marketing, and customer experience teams.
As Figma adoption grows, license counts expand across the organization, quietly increasing costs in ways most teams do not anticipate.
The majority of companies overpay for Figma not because they intentionally waste money, but because the pricing model naturally encourages seat expansion through mechanisms like auto-upgrades.
Auto-upgrades silently convert users from free Viewer seats to paid Editor seats, guests become billable without warning, teams create multiple workspaces with duplicate seats, and design system sprawl increases editing requirements.
Organizations also continue paying for seats belonging to inactive or departed users due to weak offboarding practices.
If your Figma invoice grows year over year without clear visibility into why, you are not alone, as overspending is extremely common in environments optimized for collaboration rather than cost control.
This blog provides a complete cost analysis of where organizations waste money inside Figma, how to detect overspending, and the actionable steps you can take to fix it without slowing down design velocity.
Choosing the right plan is critical, as access may vary depending on the selected plan and seats can include Figma products such as FigJam, Figma Slides, Dev Mode, Figma Design, Figma Draw, Figma Buzz, Figma Sites, and Figma Make.
Most companies do not notice Figma overspending until renewal season or when finance questions a sudden spike in SaaS expenditure.
The following warning signs indicate that you are likely spending more than necessary on Figma.
Your Editor count continues to increase month after month while design output remains steady.
This pattern is almost always caused by a handful of common issues.
Many organizations discover that a large portion of Editors rarely or never perform genuine editing work.
Instead, their behavior looks more like that of Viewers or Commenters.
These users generally do not need paid Editor seats.
Figma is rarely integrated into standard offboarding workflows, leading to lingering access and license waste.
As a result, multiple categories of users continue consuming paid licenses after they should have been removed.
Teams frequently create new Figma workspaces without informing IT or centralized admins.
This fragmented setup introduces several layers of hidden cost.
Large design and product teams often over-assign FigJam Editor seats.
In many cases, users only need free FigJam Guest access for basic collaboration.
Figma invoices can spike unexpectedly due to several usage and billing events.
If any of these patterns sound familiar, overspending is already happening.
This rapid checklist helps you gauge how much Figma overspending risk your organization carries.
If you checked four or more of these items, overspending is likely significant.
Figma overspending usually stems from a combination of structural, behavioral, and governance issues.
The sections below break down the most significant contributors to wasted spend.
One of the most expensive and least known features of Figma is auto-upgrading.
When a Viewer performs editing actions, they automatically convert to a paid Editor without requiring confirmation or notifying the admin, and the change appears directly on your invoice.
Common triggers include:
This is where many organizations lose 10 to 25 percent of their Figma budget.
Inactive seats are the number one form of Figma license waste.
CloudNuro analysis across dozens of enterprises shows trends that dramatically impact spend.
These seats accumulate silently and typically renew annually unless manually removed.
When multiple workspaces exist, a single user may end up with multiple paid seats.
This pattern is especially common in large organizations.
Duplication like this can lead to exponential spend growth.
Figma is often overlooked during user offboarding, especially for contractors and agency staff.
This oversight creates both cost and security risks.
FigJam Editor licenses cost money, but many users only require free Guest functionality.
Common unnecessary FigJam Editor assignments include:
These users rarely need the full capabilities of paid FigJam seats.
The following steps help uncover Figma overspending patterns quickly so you can take immediate corrective action.
Start by extracting recent activity data for all Figma users.
Look for the following indicators:
Users with no editing actions should be prime candidates for downgrade.
Next, use the activity report to flag inactive users over defined time windows.
These users should be downgraded or removed entirely.
Analyze your Figma workspace structure to find redundancy and fragmentation.
Consolidating workspaces reduces seat duplication and improves governance.
Guest access can accumulate over time as projects are completed and collaborators move on.
Remove the following categories of guests:
Investigate how and why Viewers are converting to Editors.
Evaluate how FigJam Editors actually use the product.
CloudNuro provides data-driven recommendations to eliminate Figma waste without slowing down your design teams.
Organizations commonly reduce Figma spend by 20 to 40 percent while maintaining or improving design velocity.
Book your Figma Optimization Assessment today.
The following scenarios are practical examples observed across mid-market and enterprise organizations using Figma.
A product team of 40 people had 28 Editor seats even though they never edited designs, instead only reviewing prototypes and commenting on flows.
After downgrading these users, the organization achieved savings of 22,000 USD per year.
Engineering teams frequently inspect designs but rarely modify them.
In one company, 75 engineers held Editor seats, and reassigning them to Viewer roles resulted in a 78 percent reduction in those license costs.
A design agency completed its engagement but retained Editor seats for six additional months.
Removing these seats generated savings of 17,000 USD.
A large enterprise operated with multiple overlapping workspaces.
Many users were billed across all nine workspaces, and consolidating them delivered savings of 120,000 USD.
One organization maintained 250 FigJam Editors, but usage data showed that advanced FigJam features were only used by a small subset of users.
By downgrading unnecessary FigJam Editors, they realized savings of over 40,000 USD.
The following actions can reduce your Figma spending within a week if executed decisively.
Impact: 15 to 25 percent savings on Figma licenses.
Systematically downgrade users who do not need full editing capabilities.
Impact: 10 to 20 percent savings.
Audit and clean up guest users to close out unnecessary access.
Impact: 5 to 10 percent savings.
Merge workspaces and centralize billing across major functions.
Impact: 10 to 15 percent savings.
Implement file and library retention rules to reduce clutter and accidental edits.
Impact: 5 to 8 percent reduction in noise and accidental editing.
This graph illustrates Figma Editor activity levels across the organization, segmented into the following categories.
The bar chart shows four categories of Figma usage by share of Editor seats.
This breakdown reveals which users truly need paid Editor seats and which can be safely downgraded or removed.
Users in the following categories represent a major opportunity for cost reduction.
Together, these groups account for 45 percent of the total Editor base.
Optimization Recommendation:
Impact: A direct 25 to 45 percent reduction in Editor seat costs.
Moderate Editors may not need full editing privileges daily, and they are at risk of triggering unnecessary upgrades over time.
Ask questions such as:
Optimization Recommendation:
Impact: Prevention of future unwanted Editor upgrades.
Heavy Editors, who make up around 25 percent of users, are actively engaged in design work and should retain Editor access.
Use graph insight to:
Impact: Improved design productivity without cutting essential seats.
The graph visually demonstrates that more than 45 percent of Editors deliver low or no value.
This visualization supports conversations around cost optimization and governance.
Impact: Clear justification to reduce spend or downgrade seats.
Using the same logic, you can build a recurring optimization playbook to maintain Figma cost control over time.
Impact: Sustained long-term cost control and prevention of wasteful seat creep.
Most companies pay for Editors who do not actually edit, and CloudNuro automates the process of identifying and downgrading these wasteful seats.
The insights and visuals described here can be repurposed across multiple channels.
Consider an example where your organization has 100 Editor seats.
Expected Reduction: 55 to 65 seats total.
If each Editor costs 45 USD per month on the Organization plan, then 65 seats saved × 45 USD × 12 months equals:
If Inactive and Light Editors reappear each quarter, you can model future waste and justify continuous governance or automation through CloudNuro.
This enables more accurate forecasts and proactive Figma budget planning.
| Category | Action | Impact |
|---|---|---|
| Heavy Editors | Keep seats | Maintain productivity |
| Moderate Editors | Audit and limit | Prevent auto upgrades |
| Light Editors | Downgrade | Save 10–20 percent |
| Inactive Editors | Remove | Save 20–25 percent |
Total Optimization Potential:
This visual concept highlights the key areas where Figma costs leak inside organizations.
Establishing governance practices around Figma usage and licensing is essential for long-term cost control.
Review Editor assignments at least every 90 days and adjust roles based on actual usage.
Integrate Figma with your HRIS system so that user offboarding automatically revokes Figma access.
Limit workspace creation rights to DesignOps or IT to prevent uncontrolled proliferation.
Lock key files to protect against accidental edits that trigger auto-upgrades from Viewer to Editor.
Define a clear mapping between roles and Figma access levels to enforce consistency.
Monitor FigJam usage and avoid upgrading users to Editors unless their activity justifies it.
Figma overspending is widespread because teams naturally adopt the tool for every stage of product design and collaboration.
While this accelerates delivery, it also increases license consumption when left unmonitored, leading to significant and often hidden costs.
By detecting inactive licenses, analyzing user behavior, rightsizing roles, cleaning up workspaces, optimizing FigJam, and introducing governance, organizations can reduce Figma spend by 20 to 40 percent within weeks.
CloudNuro addresses one of the most significant SaaS challenges: lack of visibility into license usage and cost drivers.
With automated monitoring, usage analysis, and actionable optimization recommendations, CloudNuro helps ensure you never pay for unused Figma licenses again.
CloudNuro is a leader in Enterprise SaaS Management Platforms, giving enterprises unmatched visibility, governance, and cost optimization.
Recognized twice in a row by Gartner in the SaaS Management Platforms Magic Quadrant and named a Leader in the Info-Tech SoftwareReviews Data Quadrant, CloudNuro is trusted by global enterprises and government agencies to bring financial discipline to SaaS and cloud.
Trusted by enterprises such as Konica Minolta and Federal Signal, the solution provides centralized SaaS inventory, license optimization, and renewal management, along with advanced cost allocation and chargeback.
This gives IT and Finance leaders the visibility, control, and cost-conscious culture needed to drive financial discipline.
As the only FinOps-certified Enterprise SaaS Management Platform, CloudNuro unifies SaaS and IaaS management in a single view.
With a 15-minute setup and measurable results in under 24 hours, CloudNuro gives IT teams a fast path to value.
Request a no cost, no obligation free assessment - just 15 minutes to savings!
Get StartedWe're offering complimentary ServiceNow license assessments to only 25 enterprises this quarter who want to unlock immediate savings without disrupting operations.
Get Free AssessmentGet Started


CloudNuro Corp
1755 Park St. Suite 207
Naperville, IL 60563
Phone : +1-630-277-9470
Email: info@cloudnuro.com


.webp)

Recognized Leader in SaaS Management Platforms by Info-Tech SoftwareReviews