

Sign Up
Thank you for Submitting!
Modern data-driven organizations rely on rapid insights for decision-making, but delivering these insights at scale brings financial and technical challenges. With Microsoft Fabric and Power BI, data professionals face ballooning query compute unit (CU) costs and performance bottlenecks, especially as analytic complexity and user concurrency rise.
Yet many organizations overlook a secret weapon for cost efficiency and speed: aggregation tables. When combined with FinOps governance and CloudNuro’s automated optimization, aggregation tables in Fabric can cut query CU consumption by 60%, without losing the detail business users rely on.
This guide delivers actionable strategies for leveraging Power BI aggregation tables to optimize both query performance and cloud costs, followed by answers to the most common practitioner FAQs.
Power BI and Fabric offer state-of-the-art analytics, but mismanagement of compute, especially with growing data volumes, leads to:
Runaway CU costs from high-concurrency environments
Capacity unit exhaustion during peak refresh windows
Delayed dashboards as queries wait in line
Key Insight: Semantic model refreshes dominate workloads, accounting for up to 75% of CU consumption with only 25% left for end-user reporting. High-traffic dashboards can tie up 70 to 80% of compute in sequential queries, triggering costly Premium-bursts or autoscale events paid at a 23 to 37% markup versus reserved capacity.
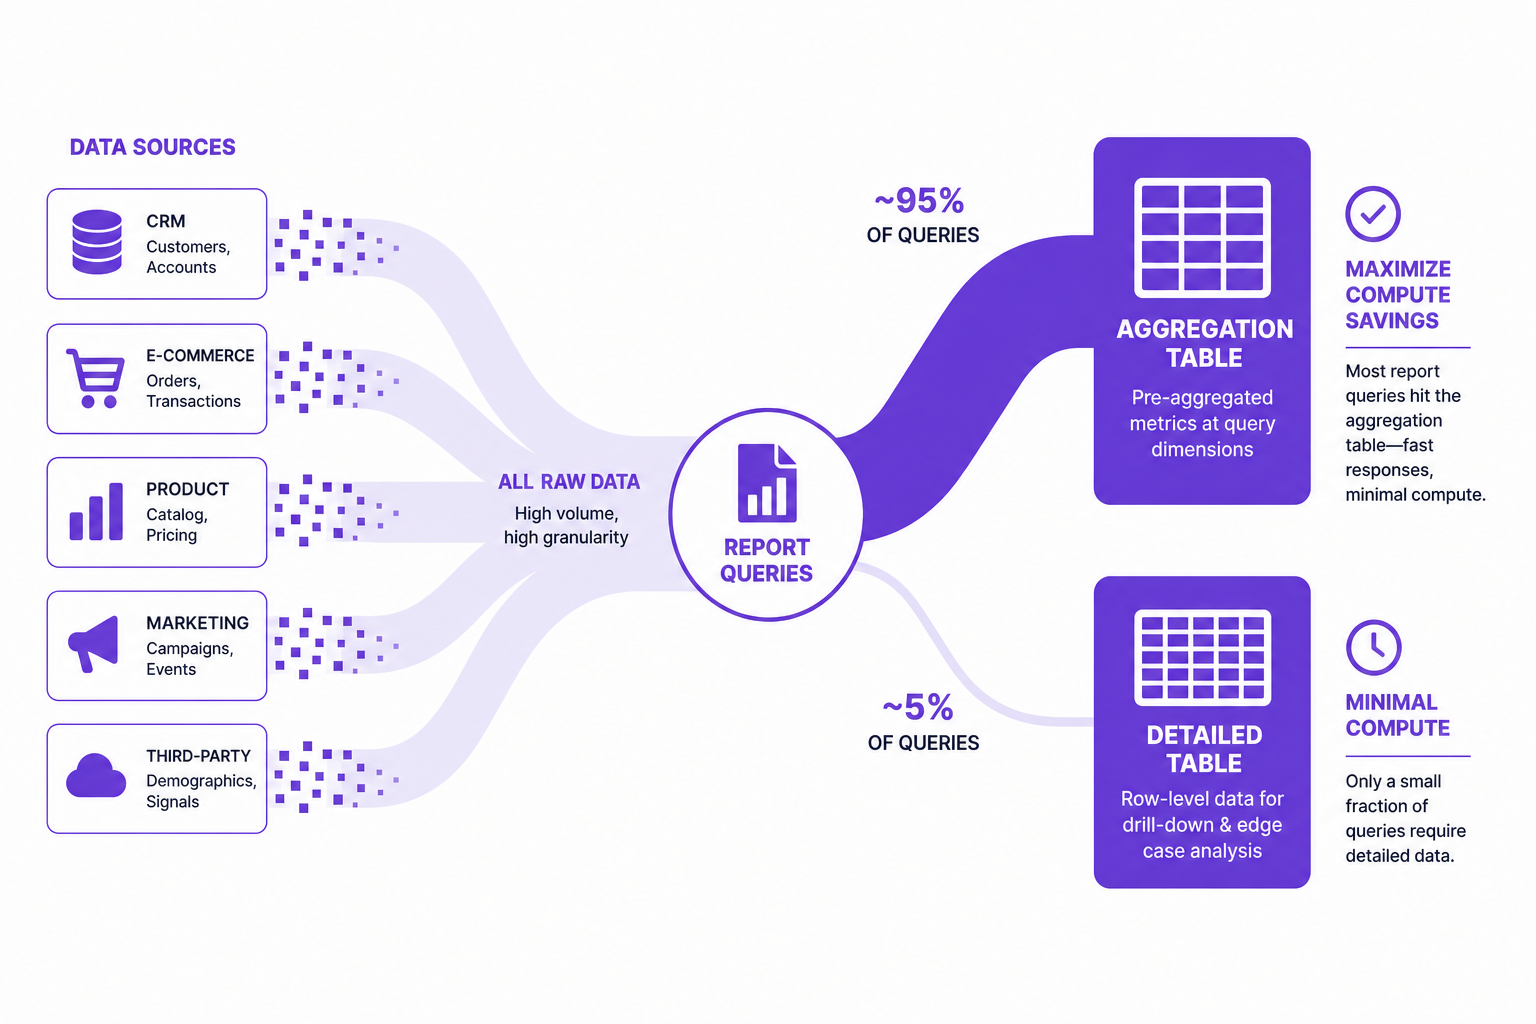
Aggregation tables are purpose-built, summary-level tables containing pre-computed values (e.g., totals by month or region). Rather than querying billions of detail rows with each report, Power BI routes compatible queries to these compact tables.
Statistics at a Glance:
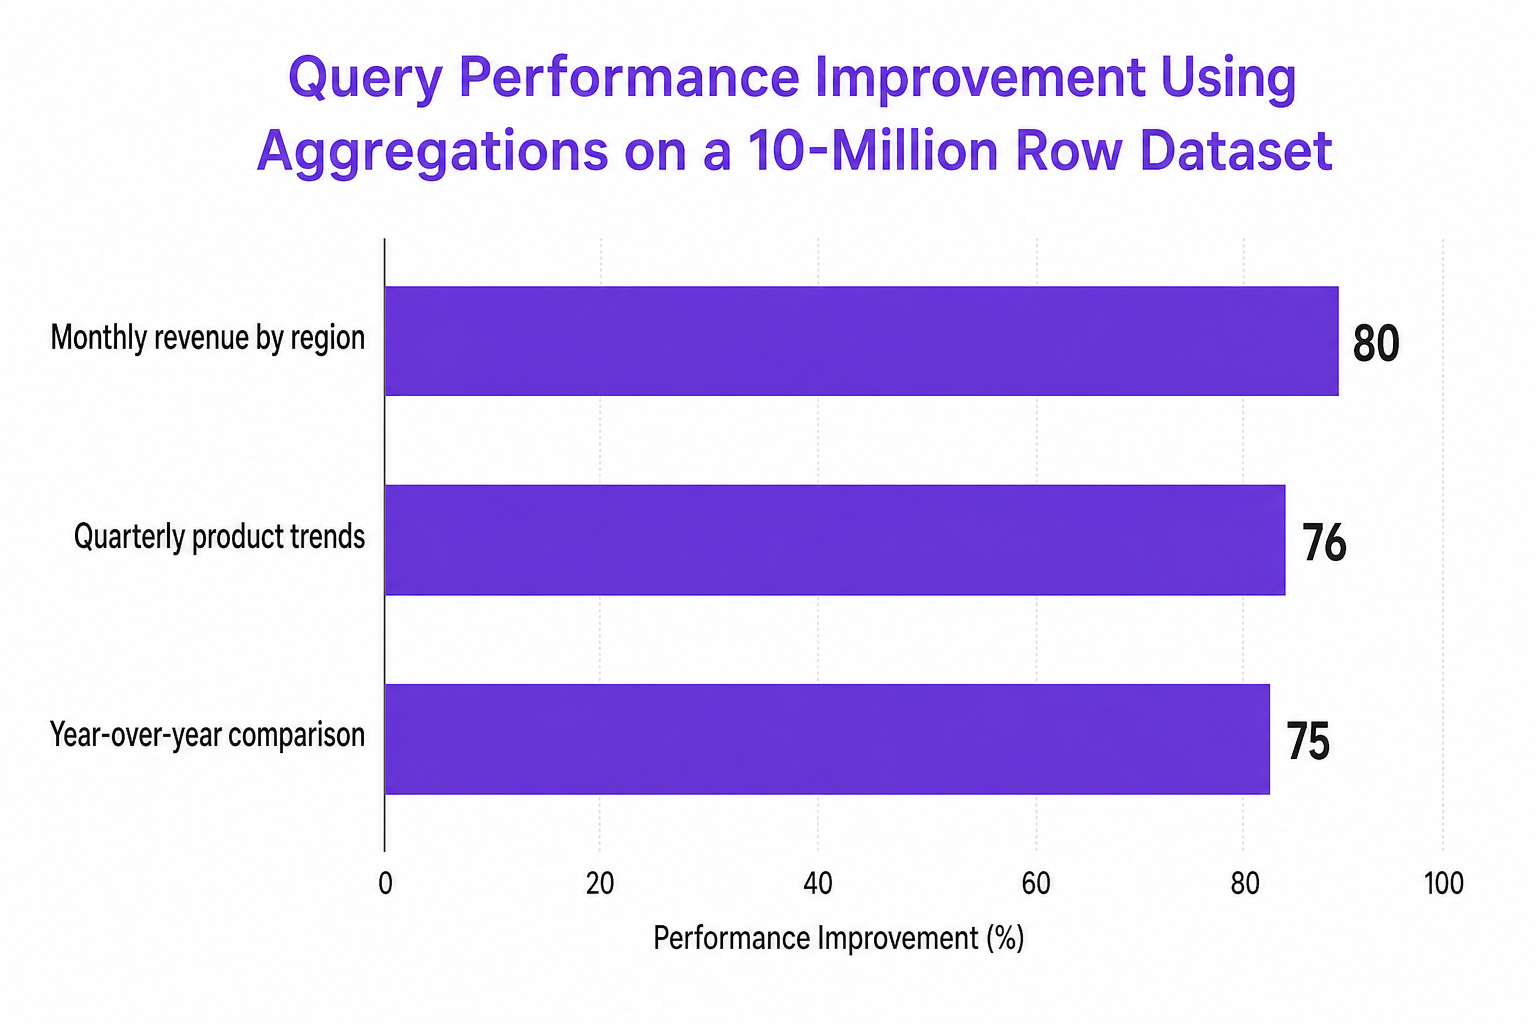
Aggregation tables deliver 10 to 100 times query performance improvements on large datasets
80 to 95% of dashboard queries can be answered from in-memory aggregation cache
Dashboard pages load in 1 second instead of 30 seconds when drawing from aggregations
Storage for aggregation tables is just 1 to 5% of detail tables
Columnstore indexes supercharge performance by up to 10 times vs. rowstore
Transparent Query Routing: With correctly configured relationships, the engine automatically determines if a query can be satisfied entirely by the aggregation table. Authors build DAX measures against the granular detail table, but reports hit aggregations for compatible queries, no manual rewrites needed.
Composite Model Best Practice:
Detail facts remain in DirectQuery mode (for up-to-the-minute data access)
Aggregation tables are stored in Import mode (for speed and cost savings)
Composite models map queries seamlessly
Automatic Aggregations: Power BI’s engine can now build and update aggregation tables based on actual usage history, further reducing compute overhead for large DirectQuery models.
Critical Setup: Missing relationships can cause aggregation bypass and negate savings; every filterable dimension in reports must relate correctly to aggregation tables.
Baseline Your Environment
Measure current dashboard load times and database resource utilization
Identify reports causing top resource drains
Prioritize High-Traffic Dashboards
Target dashboards receiving frequent reads for aggregation implementation
Track visual load times and dataset size pre and post-aggregation
Build the Right Aggregations
Choose grain by business need (e.g., by date, region, or product)
Use columnstore indexing for extra speed
Allow the engine to maintain aggregations for evolving query patterns
Optimize Model Refresh Schedules
Stagger semantic model refresh jobs outside business hours
Limit full reloads; leverage incremental refresh wherever possible
Reduce refresh frequency for low-change data
Control Compute Spikes
Shift resource-intensive pipelines to off-peak windows to avoid premium autoscale pricing
Monitor for underutilized capacities and rightsize with automated workflows
Aggregation tables can drive radical savings, but only with clear governance and automatic enforcement. This is where CloudNuro’s FinOps services excel:
Automated Compute Rightsizing: Cloud Commitments Optimization engine continuously tailors compute based on usage, shifting workloads to avoid costly premiums and autoscale penalties.
Unified Visibility: Centralized dashboards track CU consumption and identify underutilized or overprovisioned capacities before cost spikes occur.
Chargeback and Cost Allocation: Departmental budget mapping brings accountability, using CloudNuro’s seamless integration with compute telemetry for precise tracking.
Industry-Proven Outcomes:
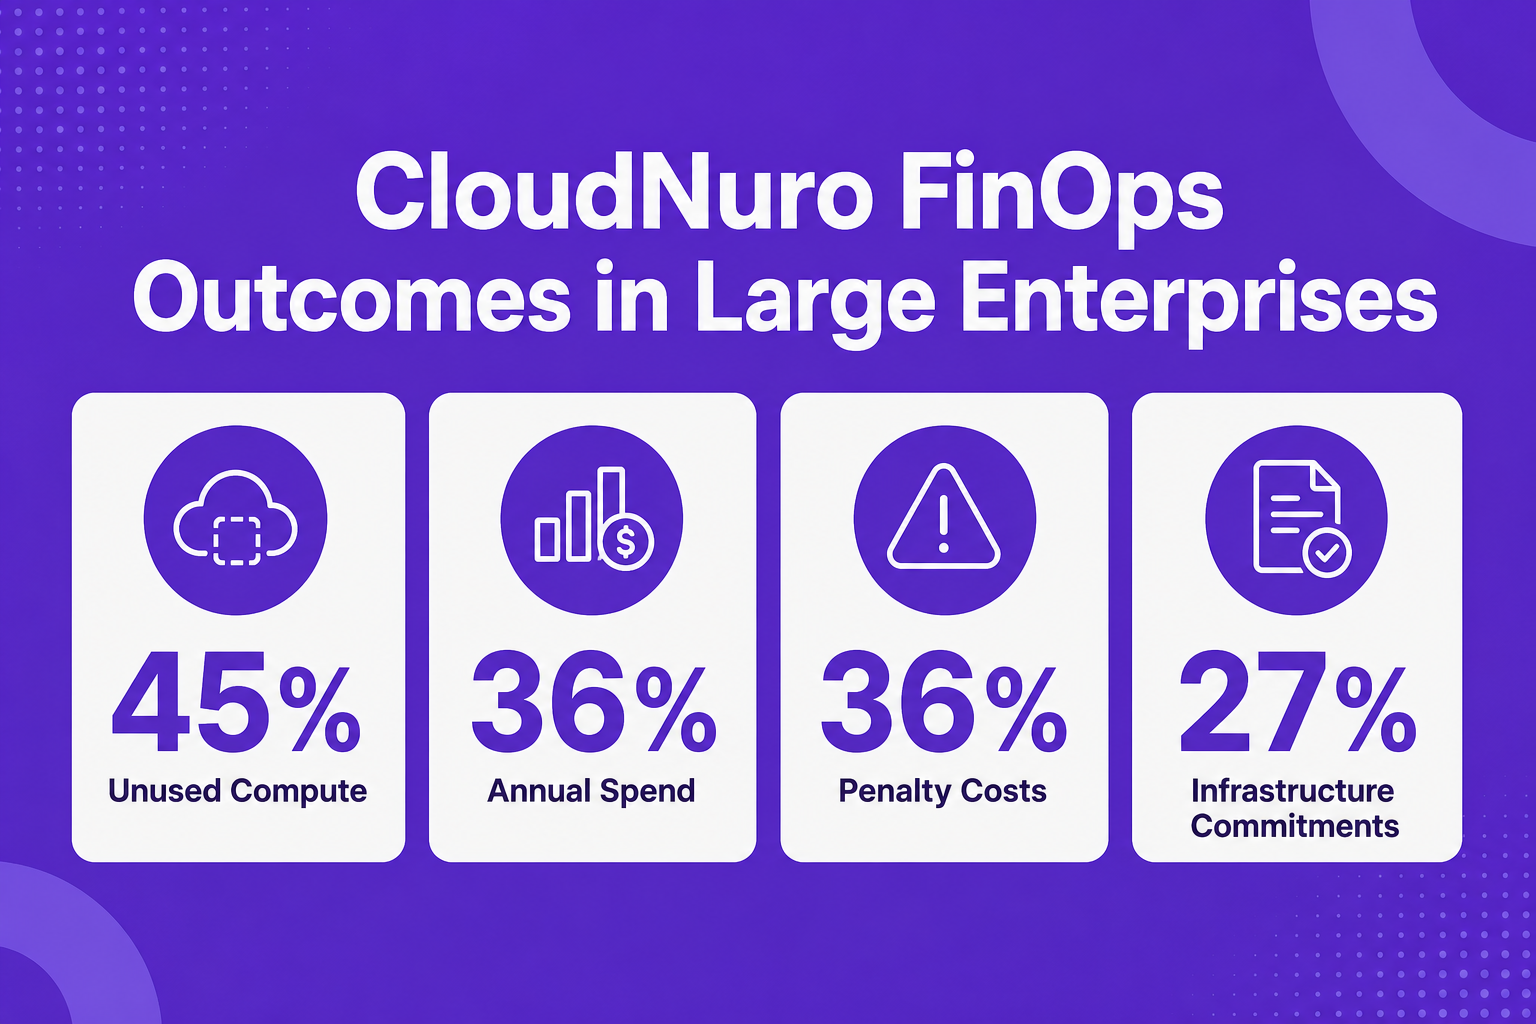
One organization cut unused compute capacity by 45% and reduced analytics platform spend by 36%
Another group automated chargebacks across 27 departments, slashing penalty costs by more than one third
Infrastructure savings from 27% to 55% were realized via rightsizing and license reclamation
Explore CloudNuro SaaS Management and FinOps Services for expert help optimizing query strategies: FinOps Services | SaaS Management
How do aggregation tables work in Power BI?
Aggregation tables are summary versions of detail tables, containing pre-computed data at a coarser grain. When users query dashboards or reports, Power BI's engine identifies if the query can be answered by the aggregation table, delivering much faster response by sidestepping large detail scans.
What are best practices for optimizing query CU consumption in Fabric?
Baseline current performance, focus on building aggregations for high-demand dashboards, use incremental refresh, and align workloads with off-peak compute windows. Monitor capacity consumption and leverage automated governance tools like CloudNuro for ongoing rightsizing.
How do you reduce Power BI costs using aggregation tables?
By pre-aggregating commonly-used calculations, you reduce the compute needed for every dashboard view. This lowers both active query cost and resource needs for report consumers.
What is the performance impact of aggregation tables in Power BI?
Performance gains range from 10 to 100 times for supported queries, with 1-second dashboard loads for queries routed to in-memory aggregations and dramatic reductions in database compute load.
How can you maintain report detail while optimizing Fabric query performance?
Composite modeling allows both detailed and aggregated tables to coexist. Regular queries hit the aggregation for speed and cost savings, while drill-through or ad hoc analysis can still reference the full detail table for granular insights.
Strategically implemented aggregation tables are the critical link between analytics speed, deep detail, and cost control. But true operational benefits emerge only when paired with governance and continuous optimization.
With CloudNuro’s FinOps services, organizations get:
Automated capacity rightsizing and cost allocation
Centralized governance for compliance and security
Ongoing visibility and proactive savings
Unlock a disciplined, high-performance analytics environment today. Explore CloudNuro product solutions, request a demo, or start saving on your analytics workloads.
About CloudNuro
CloudNuro is a leader in Enterprise AI Adoption Management, providing enterprises with unmatched visibility, governance, and cost optimization. Recognized in the SaaS Management Platforms category and named a Leader in the Data Quadrant, CloudNuro is trusted to bring financial discipline to SaaS, cloud, and AI. CloudNuro provides centralized SaaS inventory, license optimization, and renewal management along with advanced cost allocation and chargeback, giving IT and Finance leaders the visibility, control, and cost-conscious culture needed to drive financial discipline.
Request a no cost, no obligation free assessment —just 15 minutes to savings!
Get StartedModern data-driven organizations rely on rapid insights for decision-making, but delivering these insights at scale brings financial and technical challenges. With Microsoft Fabric and Power BI, data professionals face ballooning query compute unit (CU) costs and performance bottlenecks, especially as analytic complexity and user concurrency rise.
Yet many organizations overlook a secret weapon for cost efficiency and speed: aggregation tables. When combined with FinOps governance and CloudNuro’s automated optimization, aggregation tables in Fabric can cut query CU consumption by 60%, without losing the detail business users rely on.
This guide delivers actionable strategies for leveraging Power BI aggregation tables to optimize both query performance and cloud costs, followed by answers to the most common practitioner FAQs.
Power BI and Fabric offer state-of-the-art analytics, but mismanagement of compute, especially with growing data volumes, leads to:
Runaway CU costs from high-concurrency environments
Capacity unit exhaustion during peak refresh windows
Delayed dashboards as queries wait in line
Key Insight: Semantic model refreshes dominate workloads, accounting for up to 75% of CU consumption with only 25% left for end-user reporting. High-traffic dashboards can tie up 70 to 80% of compute in sequential queries, triggering costly Premium-bursts or autoscale events paid at a 23 to 37% markup versus reserved capacity.
Aggregation tables are purpose-built, summary-level tables containing pre-computed values (e.g., totals by month or region). Rather than querying billions of detail rows with each report, Power BI routes compatible queries to these compact tables.
Statistics at a Glance:
Aggregation tables deliver 10 to 100 times query performance improvements on large datasets
80 to 95% of dashboard queries can be answered from in-memory aggregation cache
Dashboard pages load in 1 second instead of 30 seconds when drawing from aggregations
Storage for aggregation tables is just 1 to 5% of detail tables
Columnstore indexes supercharge performance by up to 10 times vs. rowstore
Transparent Query Routing: With correctly configured relationships, the engine automatically determines if a query can be satisfied entirely by the aggregation table. Authors build DAX measures against the granular detail table, but reports hit aggregations for compatible queries, no manual rewrites needed.
Composite Model Best Practice:
Detail facts remain in DirectQuery mode (for up-to-the-minute data access)
Aggregation tables are stored in Import mode (for speed and cost savings)
Composite models map queries seamlessly
Automatic Aggregations: Power BI’s engine can now build and update aggregation tables based on actual usage history, further reducing compute overhead for large DirectQuery models.
Critical Setup: Missing relationships can cause aggregation bypass and negate savings; every filterable dimension in reports must relate correctly to aggregation tables.
Baseline Your Environment
Measure current dashboard load times and database resource utilization
Identify reports causing top resource drains
Prioritize High-Traffic Dashboards
Target dashboards receiving frequent reads for aggregation implementation
Track visual load times and dataset size pre and post-aggregation
Build the Right Aggregations
Choose grain by business need (e.g., by date, region, or product)
Use columnstore indexing for extra speed
Allow the engine to maintain aggregations for evolving query patterns
Optimize Model Refresh Schedules
Stagger semantic model refresh jobs outside business hours
Limit full reloads; leverage incremental refresh wherever possible
Reduce refresh frequency for low-change data
Control Compute Spikes
Shift resource-intensive pipelines to off-peak windows to avoid premium autoscale pricing
Monitor for underutilized capacities and rightsize with automated workflows
Aggregation tables can drive radical savings, but only with clear governance and automatic enforcement. This is where CloudNuro’s FinOps services excel:
Automated Compute Rightsizing: Cloud Commitments Optimization engine continuously tailors compute based on usage, shifting workloads to avoid costly premiums and autoscale penalties.
Unified Visibility: Centralized dashboards track CU consumption and identify underutilized or overprovisioned capacities before cost spikes occur.
Chargeback and Cost Allocation: Departmental budget mapping brings accountability, using CloudNuro’s seamless integration with compute telemetry for precise tracking.
Industry-Proven Outcomes:
One organization cut unused compute capacity by 45% and reduced analytics platform spend by 36%
Another group automated chargebacks across 27 departments, slashing penalty costs by more than one third
Infrastructure savings from 27% to 55% were realized via rightsizing and license reclamation
Explore CloudNuro SaaS Management and FinOps Services for expert help optimizing query strategies: FinOps Services | SaaS Management
How do aggregation tables work in Power BI?
Aggregation tables are summary versions of detail tables, containing pre-computed data at a coarser grain. When users query dashboards or reports, Power BI's engine identifies if the query can be answered by the aggregation table, delivering much faster response by sidestepping large detail scans.
What are best practices for optimizing query CU consumption in Fabric?
Baseline current performance, focus on building aggregations for high-demand dashboards, use incremental refresh, and align workloads with off-peak compute windows. Monitor capacity consumption and leverage automated governance tools like CloudNuro for ongoing rightsizing.
How do you reduce Power BI costs using aggregation tables?
By pre-aggregating commonly-used calculations, you reduce the compute needed for every dashboard view. This lowers both active query cost and resource needs for report consumers.
What is the performance impact of aggregation tables in Power BI?
Performance gains range from 10 to 100 times for supported queries, with 1-second dashboard loads for queries routed to in-memory aggregations and dramatic reductions in database compute load.
How can you maintain report detail while optimizing Fabric query performance?
Composite modeling allows both detailed and aggregated tables to coexist. Regular queries hit the aggregation for speed and cost savings, while drill-through or ad hoc analysis can still reference the full detail table for granular insights.
Strategically implemented aggregation tables are the critical link between analytics speed, deep detail, and cost control. But true operational benefits emerge only when paired with governance and continuous optimization.
With CloudNuro’s FinOps services, organizations get:
Automated capacity rightsizing and cost allocation
Centralized governance for compliance and security
Ongoing visibility and proactive savings
Unlock a disciplined, high-performance analytics environment today. Explore CloudNuro product solutions, request a demo, or start saving on your analytics workloads.
About CloudNuro
CloudNuro is a leader in Enterprise AI Adoption Management, providing enterprises with unmatched visibility, governance, and cost optimization. Recognized in the SaaS Management Platforms category and named a Leader in the Data Quadrant, CloudNuro is trusted to bring financial discipline to SaaS, cloud, and AI. CloudNuro provides centralized SaaS inventory, license optimization, and renewal management along with advanced cost allocation and chargeback, giving IT and Finance leaders the visibility, control, and cost-conscious culture needed to drive financial discipline.
Request a no cost, no obligation free assessment - just 15 minutes to savings!
Get StartedWe're offering complimentary ServiceNow license assessments to only 25 enterprises this quarter who want to unlock immediate savings without disrupting operations.
Get Free AssessmentGet Started




CloudNuro Corp
1755 Park St. Suite 207
Naperville, IL 60563
Phone : +1-630-277-9470
Email: info@cloudnuro.com





.webp)

Recognized Leader in SaaS Management Platforms by Info-Tech SoftwareReviews

.png)


.svg)