

Sign Up
Thank you for Submitting!
Monitoring fabric capacity metrics is no longer a technical afterthought, it's now a business imperative for every enterprise. With SaaS and cloud adoption accelerating, keeping a close pulse on your platform's capacity metrics is critical to ensure efficiency, cost control, and risk mitigation. Missed signals in capacity trends can result in budget overruns, degraded performance, and lost productivity.
This article breaks down the seven fabric capacity metrics every admin should monitor weekly and shows how unified, AI-powered tools like CloudNuro transform data into actionable insights. From license optimization to chargeback alignment, these metrics form the bedrock of modern cloud governance.
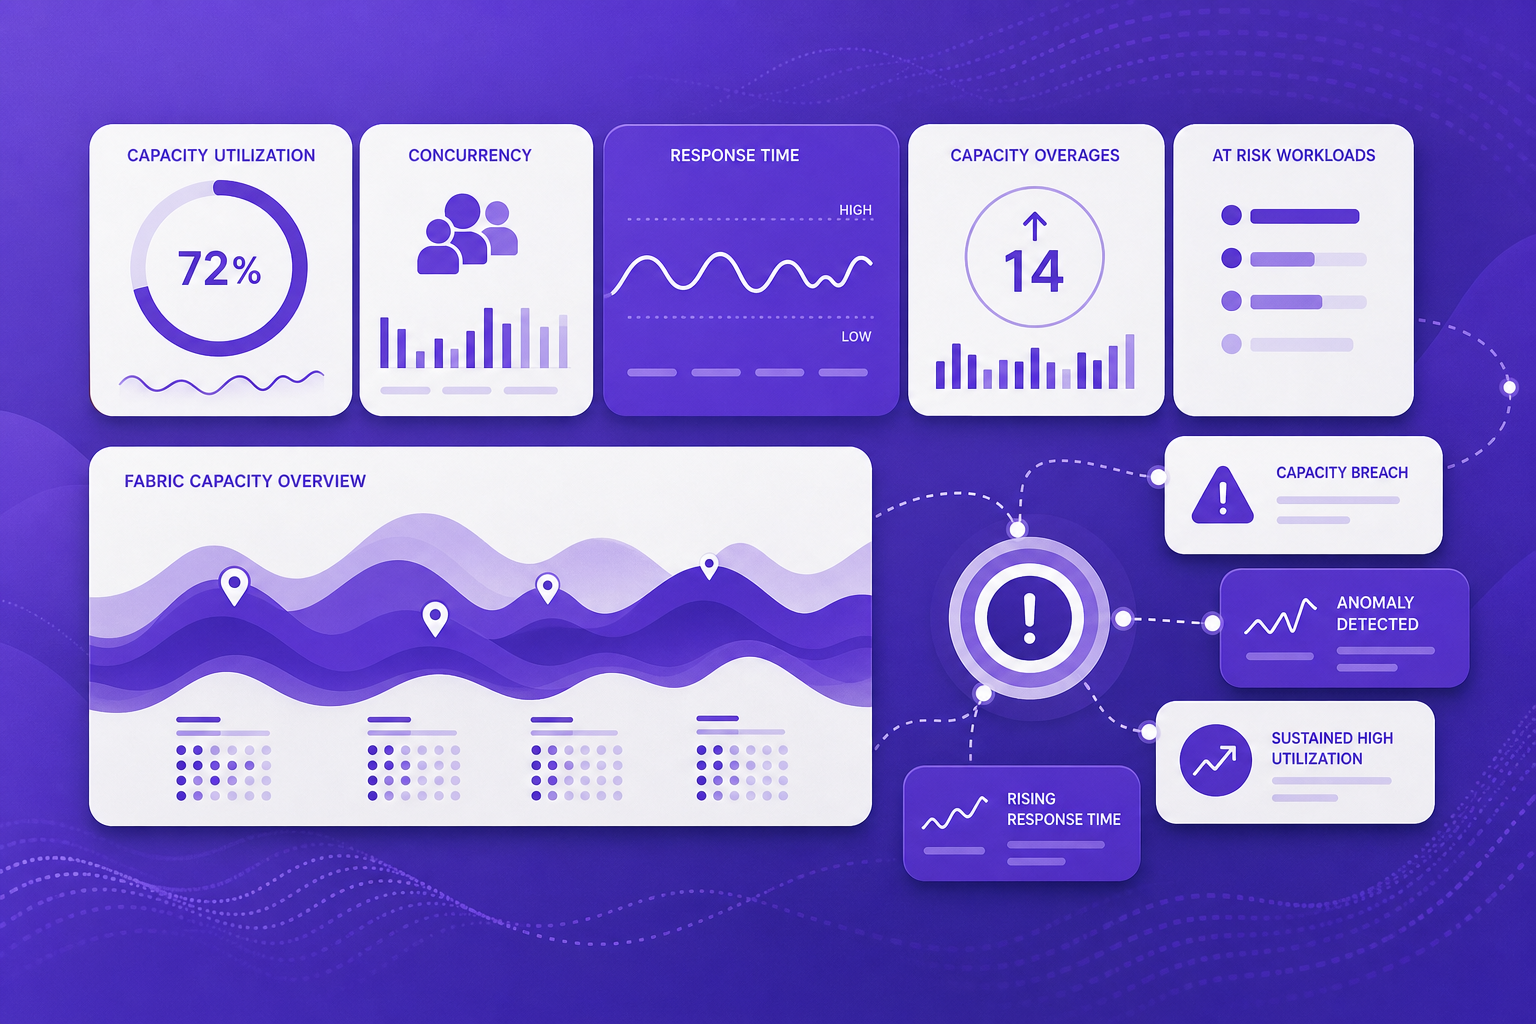
Fabric capacity metrics are essential for cloud and SaaS operations because:
With operational telemetry consolidated, enterprises gain not only clarity but also a governance framework that maximizes every dollar spent on SaaS and cloud technologies.
This primary indicator reflects how much of your purchased or allocated capacity is actually being used. If your utilization consistently trends below 60%, you're likely overpaying for unused infrastructure. Conversely, regularly peaking above 90% indicates a risk of throttling or slowdowns. Automated tools that flag these thresholds enable quick intervention.
At peak hours, only 15% to 25% of licensed users are concurrently active, while a large share of capacity sits idle. Weekly tracking of concurrency rates and user activity ensures license optimization and reduces risk from inactive accounts, helping admins identify where resource allocations are excessive or misaligned.
Sluggish response times and surging queue delays are operational red flags. Efficient platforms track both metrics in real time, providing admins with instant alerts when digital workloads queue up or exceed SLA thresholds. Rapid response to these signals is key to sustaining performance for critical workflows.
Autoscale is powerful but costly. Enterprises leveraging pay-as-you-go scaling without close capacity metric monitoring face 23% to 37% premiums on burst workloads. Weekly reviews of overage events, duration, and billed costs spotlight costly patterns that require immediate optimization.
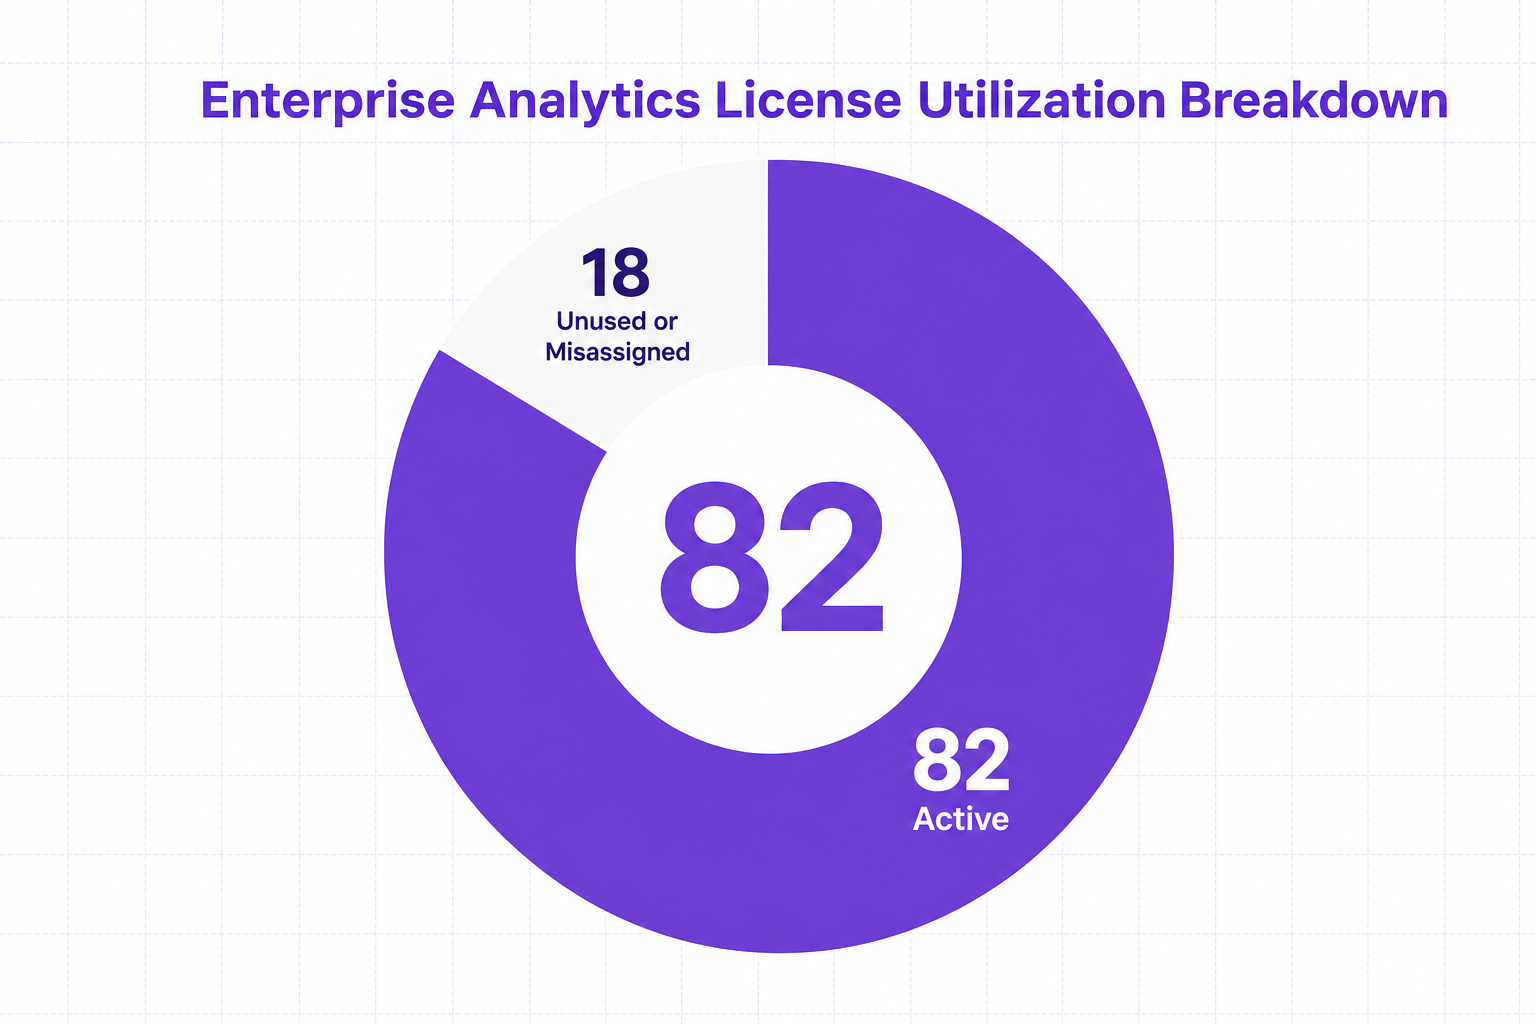
Up to 18% of licenses are unused or left assigned to inactive users, draining budgets and creating access risks. By automating license reclamation and aligning onboarding/offboarding to HR events, organizations can sharply reduce license sprawl and shrink compliance risk profiles.
Tracking which departments, cost centers, or individual users drive platform utilization allows targeted chargeback and cost allocation. The CloudNuro Chargeback module, for example, applies metadata tags to tie consumption directly to business units for transparent financial governance.
Proactive alerts triggered by custom budgets, consumption thresholds, or even automated anomaly detection help avoid unplanned spikes and budget surprises. Admins empowered with timely, AI-driven insights can act decisively before small issues become business disruptions.
1. Automate Data Collection
Manual monthly reviews lead to missed optimization windows. Deploy unified telemetry tools that gather and surface data across all your SaaS, Microsoft 365, and cloud workloads, retaining more than the standard two weeks of history for reliable trend analysis.
2. Schedule Weekly Capacity Reviews
Make fabric capacity reviews a formal weekly routine. Use dashboards and scheduled reports to share key metrics with IT, finance, and operations leaders. The best dashboards trend data, provide context on efficiency benchmarks, and highlight critical action items.
3. Benchmark Against Industry Standards
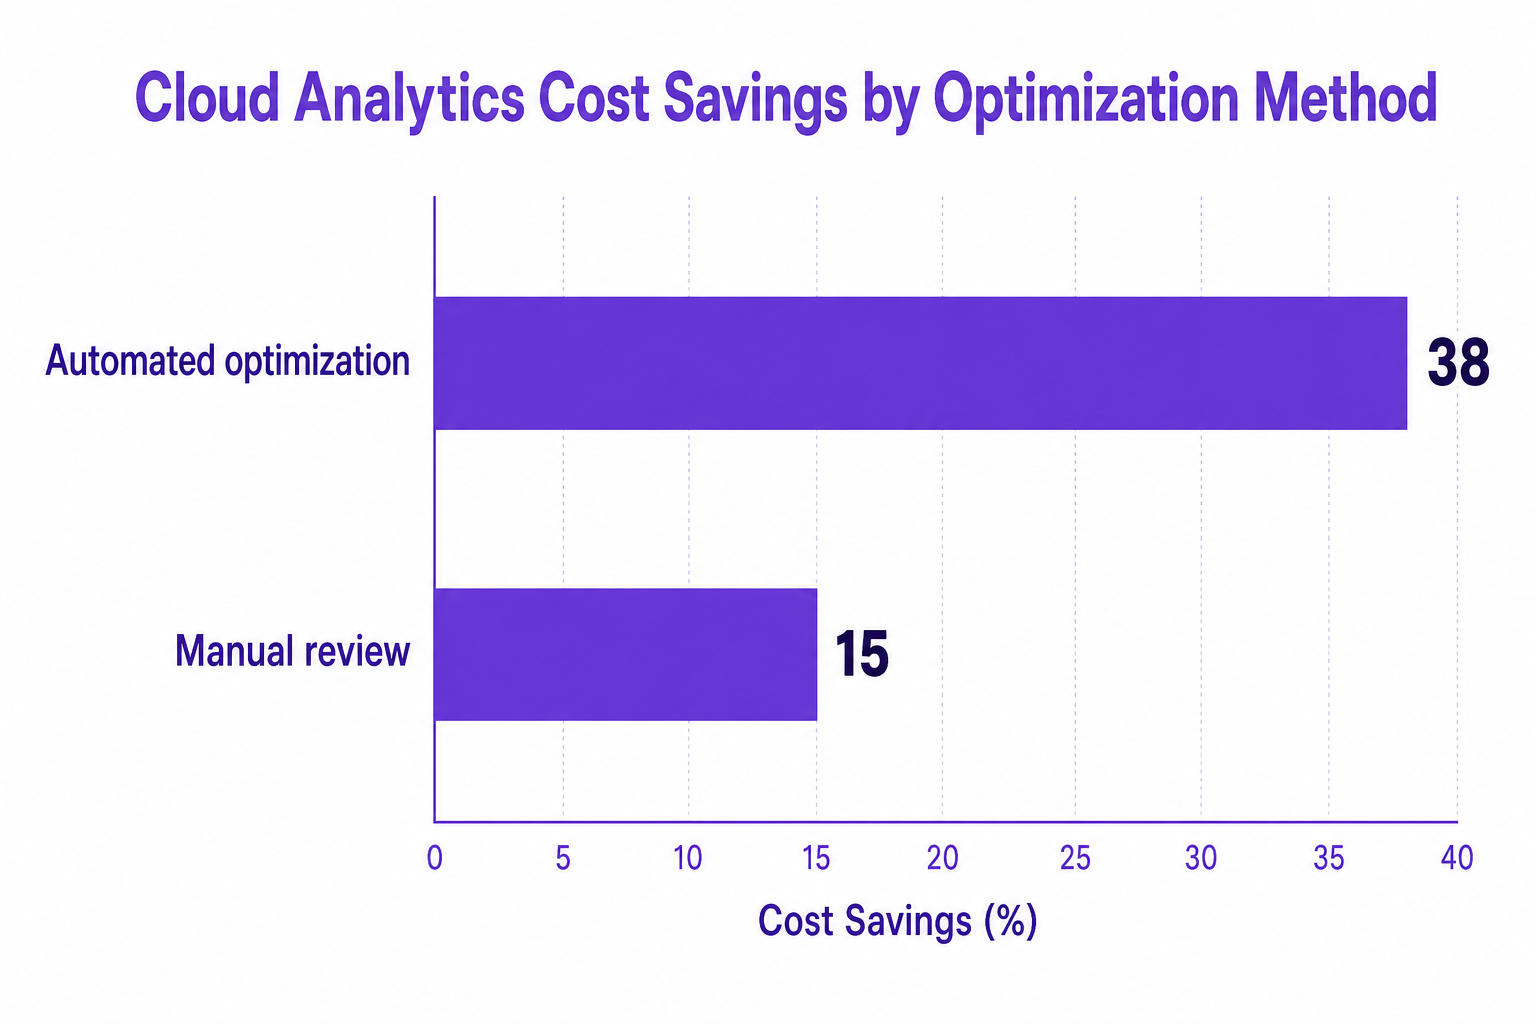
Regularly stack your platform metrics against proven efficiency benchmarks. Leading organizations using automated optimization achieve up to 38% cost savings, far outperforming manual review processes.
4. Close the Loop with Automated Optimization
Move from monitoring to action by implementing capacity downshifting, orphaned license clean-up, and scheduled workspace pauses using workflow automation. Real-time recommendations and automation are essential to capture maximum savings and reduce manual effort.
CloudNuro empowers enterprise admins with:
Proof in Practice:
- A pharma enterprise saw a 36% reduction in overage penalties and automated allocation across 27 departments within a year.
- A multinational bank cut unused compute capacity by 45% and slashed spend by 36% using automated rightsizing.
- A healthcare provider shortened its quarter-close process by 30% while achieving real-time SaaS spend optimization.

What are the key fabric capacity metrics admins should track?
Admins should monitor total utilization, concurrency, response times, overages, orphaned licenses, workload distribution, and anomaly alerts each week to ensure efficiency and control.
How do you monitor Microsoft Fabric capacity metrics?
Native apps provide a high-level overview, but platforms like CloudNuro deliver deeper telemetry, extended historical data, and proactive automation for more robust monitoring and governance.
Why are fabric capacity KPIs important for IT governance?
Capacity KPIs drive better cost allocation, boost accountability, prevent security/compliance gaps, and optimize both spending and platform performance.
What is the best way to generate a capacity utilization report?
Leverage automated tools that collect, analyze, and visualize usage data across platforms, supporting automated recommendations and instant reporting.
How often should we review fabric capacity metrics?
A weekly review cadence is essential for timely intervention, continuous optimization, and avoiding costly inefficiencies.
Robust, weekly attention to fabric capacity metrics delivers operational resilience, real cost savings, and actionable governance. With AI-driven platforms like CloudNuro, CIOs and IT leaders empower their teams to monitor, act, and optimize continuously, transforming reactive management into proactive excellence. Ignoring these numbers is no longer an option in a world where cloud and SaaS investments touch every business outcome.
CloudNuro is a leader in Enterprise AI Adoption Management, providing enterprises with unmatched visibility, governance, and cost optimization. Recognized twice in a row in the SaaS Management Platforms category and named a Leader in the SoftwareReviews Data Quadrant, CloudNuro is trusted by global enterprises and government agencies to bring financial discipline to SaaS, cloud, and AI. Trusted by enterprises, CloudNuro provides centralized SaaS inventory, license optimization, and renewal management along with advanced cost allocation and chargeback, giving IT and Finance leaders the visibility, control, and cost-conscious culture needed to drive financial discipline. Request a Demo | Get Free Savings | Explore Product
Request a no cost, no obligation free assessment —just 15 minutes to savings!
Get StartedMonitoring fabric capacity metrics is no longer a technical afterthought, it's now a business imperative for every enterprise. With SaaS and cloud adoption accelerating, keeping a close pulse on your platform's capacity metrics is critical to ensure efficiency, cost control, and risk mitigation. Missed signals in capacity trends can result in budget overruns, degraded performance, and lost productivity.
This article breaks down the seven fabric capacity metrics every admin should monitor weekly and shows how unified, AI-powered tools like CloudNuro transform data into actionable insights. From license optimization to chargeback alignment, these metrics form the bedrock of modern cloud governance.
Fabric capacity metrics are essential for cloud and SaaS operations because:
With operational telemetry consolidated, enterprises gain not only clarity but also a governance framework that maximizes every dollar spent on SaaS and cloud technologies.
This primary indicator reflects how much of your purchased or allocated capacity is actually being used. If your utilization consistently trends below 60%, you're likely overpaying for unused infrastructure. Conversely, regularly peaking above 90% indicates a risk of throttling or slowdowns. Automated tools that flag these thresholds enable quick intervention.
At peak hours, only 15% to 25% of licensed users are concurrently active, while a large share of capacity sits idle. Weekly tracking of concurrency rates and user activity ensures license optimization and reduces risk from inactive accounts, helping admins identify where resource allocations are excessive or misaligned.
Sluggish response times and surging queue delays are operational red flags. Efficient platforms track both metrics in real time, providing admins with instant alerts when digital workloads queue up or exceed SLA thresholds. Rapid response to these signals is key to sustaining performance for critical workflows.
Autoscale is powerful but costly. Enterprises leveraging pay-as-you-go scaling without close capacity metric monitoring face 23% to 37% premiums on burst workloads. Weekly reviews of overage events, duration, and billed costs spotlight costly patterns that require immediate optimization.
Up to 18% of licenses are unused or left assigned to inactive users, draining budgets and creating access risks. By automating license reclamation and aligning onboarding/offboarding to HR events, organizations can sharply reduce license sprawl and shrink compliance risk profiles.
Tracking which departments, cost centers, or individual users drive platform utilization allows targeted chargeback and cost allocation. The CloudNuro Chargeback module, for example, applies metadata tags to tie consumption directly to business units for transparent financial governance.
Proactive alerts triggered by custom budgets, consumption thresholds, or even automated anomaly detection help avoid unplanned spikes and budget surprises. Admins empowered with timely, AI-driven insights can act decisively before small issues become business disruptions.
1. Automate Data Collection
Manual monthly reviews lead to missed optimization windows. Deploy unified telemetry tools that gather and surface data across all your SaaS, Microsoft 365, and cloud workloads, retaining more than the standard two weeks of history for reliable trend analysis.
2. Schedule Weekly Capacity Reviews
Make fabric capacity reviews a formal weekly routine. Use dashboards and scheduled reports to share key metrics with IT, finance, and operations leaders. The best dashboards trend data, provide context on efficiency benchmarks, and highlight critical action items.
3. Benchmark Against Industry Standards
Regularly stack your platform metrics against proven efficiency benchmarks. Leading organizations using automated optimization achieve up to 38% cost savings, far outperforming manual review processes.
4. Close the Loop with Automated Optimization
Move from monitoring to action by implementing capacity downshifting, orphaned license clean-up, and scheduled workspace pauses using workflow automation. Real-time recommendations and automation are essential to capture maximum savings and reduce manual effort.
CloudNuro empowers enterprise admins with:
Proof in Practice:
- A pharma enterprise saw a 36% reduction in overage penalties and automated allocation across 27 departments within a year.
- A multinational bank cut unused compute capacity by 45% and slashed spend by 36% using automated rightsizing.
- A healthcare provider shortened its quarter-close process by 30% while achieving real-time SaaS spend optimization.
What are the key fabric capacity metrics admins should track?
Admins should monitor total utilization, concurrency, response times, overages, orphaned licenses, workload distribution, and anomaly alerts each week to ensure efficiency and control.
How do you monitor Microsoft Fabric capacity metrics?
Native apps provide a high-level overview, but platforms like CloudNuro deliver deeper telemetry, extended historical data, and proactive automation for more robust monitoring and governance.
Why are fabric capacity KPIs important for IT governance?
Capacity KPIs drive better cost allocation, boost accountability, prevent security/compliance gaps, and optimize both spending and platform performance.
What is the best way to generate a capacity utilization report?
Leverage automated tools that collect, analyze, and visualize usage data across platforms, supporting automated recommendations and instant reporting.
How often should we review fabric capacity metrics?
A weekly review cadence is essential for timely intervention, continuous optimization, and avoiding costly inefficiencies.
Robust, weekly attention to fabric capacity metrics delivers operational resilience, real cost savings, and actionable governance. With AI-driven platforms like CloudNuro, CIOs and IT leaders empower their teams to monitor, act, and optimize continuously, transforming reactive management into proactive excellence. Ignoring these numbers is no longer an option in a world where cloud and SaaS investments touch every business outcome.
CloudNuro is a leader in Enterprise AI Adoption Management, providing enterprises with unmatched visibility, governance, and cost optimization. Recognized twice in a row in the SaaS Management Platforms category and named a Leader in the SoftwareReviews Data Quadrant, CloudNuro is trusted by global enterprises and government agencies to bring financial discipline to SaaS, cloud, and AI. Trusted by enterprises, CloudNuro provides centralized SaaS inventory, license optimization, and renewal management along with advanced cost allocation and chargeback, giving IT and Finance leaders the visibility, control, and cost-conscious culture needed to drive financial discipline. Request a Demo | Get Free Savings | Explore Product
Request a no cost, no obligation free assessment - just 15 minutes to savings!
Get StartedWe're offering complimentary ServiceNow license assessments to only 25 enterprises this quarter who want to unlock immediate savings without disrupting operations.
Get Free AssessmentGet Started




CloudNuro Corp
1755 Park St. Suite 207
Naperville, IL 60563
Phone : +1-630-277-9470
Email: info@cloudnuro.com





.webp)

Recognized Leader in SaaS Management Platforms by Info-Tech SoftwareReviews


.svg)