
Sign Up
Thank you for Submitting!
For many enterprises, the question is no longer if they will move from Power BI Premium P-SKUs to Fabric F-SKUs, but how to manage the power bi premium to fabric migration cost and operational impact. With P-SKU retirement nearing and Fabric emerging as the unified analytics platform, CIOs, IT finance, and data leaders must treat this as both a licensing shift and a structural modernization of analytics spend.
Gartner reports that enterprises moving to Fabric F-SKUs are seeing an average 24 percent cost reduction versus equivalent Power BI Premium P-SKUs once workloads are optimized (Gartner 2026). Yet 98 percent of IT leaders also say governance and license complexity is a major barrier during migration (ISG 2026). This walkthrough provides a practical, numbers-driven view of costs, the key differences between P and F models, and how to manage migration as a disciplined FinOps initiative.
Power BI Premium P-SKUs were built for dedicated BI capacity. Fabric F-SKUs, in contrast, cover a broader analytics fabric including BI, data engineering, data science, and more, with a unified capacity pool.
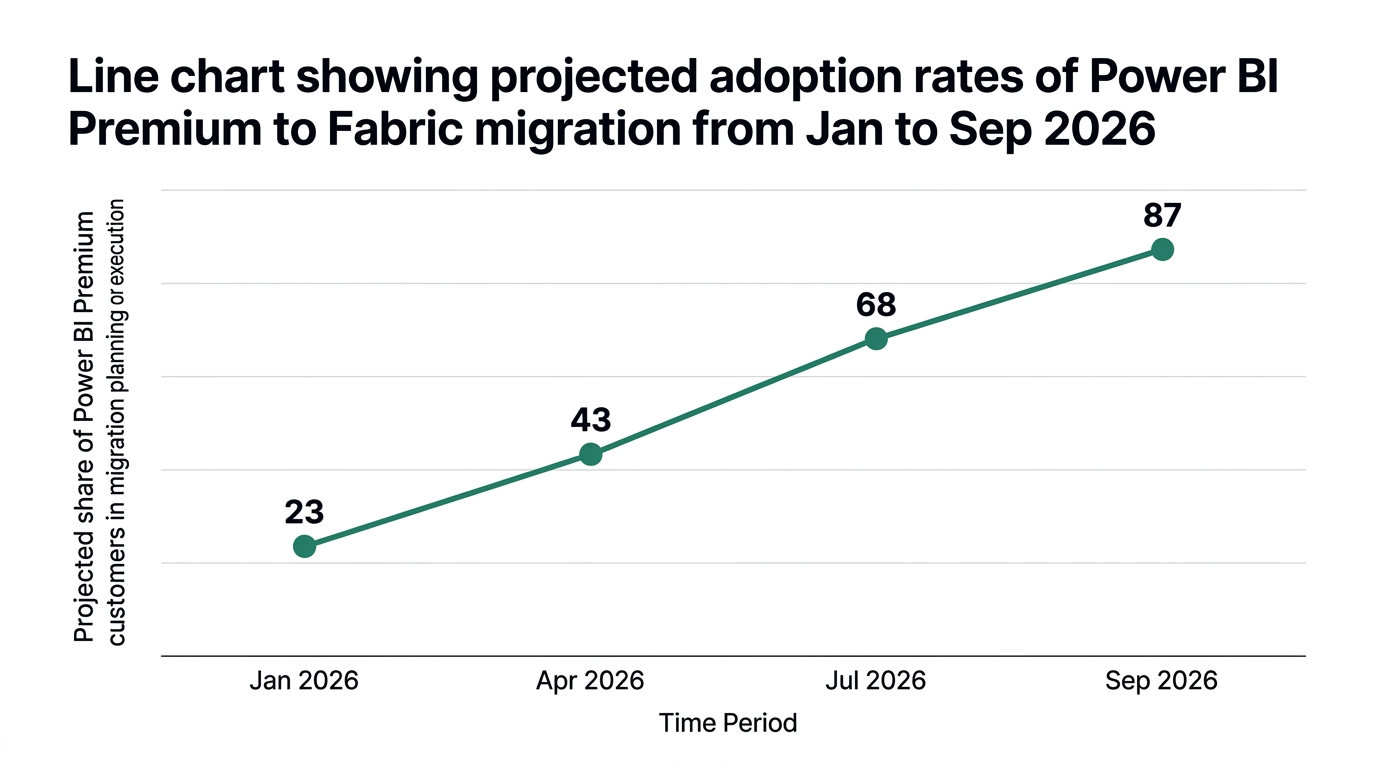
By September 2026, Power BI Premium P-SKUs are projected to be fully retired as a primary model, with 87 percent of customers already in planning or execution for migration by May 2026 (IDC 2026). That deadline forces enterprises to reassess not only license types but also capacity planning, chargeback models, and governance.
The retirement pressure can tempt teams to "lift and shift" P1 capacity to an equivalent F64 capacity without redesigning workloads. That is often the most expensive path. The smarter approach is to treat migration as an analytics modernization and cost-optimization project, not a one-for-one SKU replacement.
Two economic realities to consider:
Enterprises that use this inflection point to right-size typically see 21 percent lower monthly analytics platform expenditures through reserved F-SKU capacity (Forrester 2026).
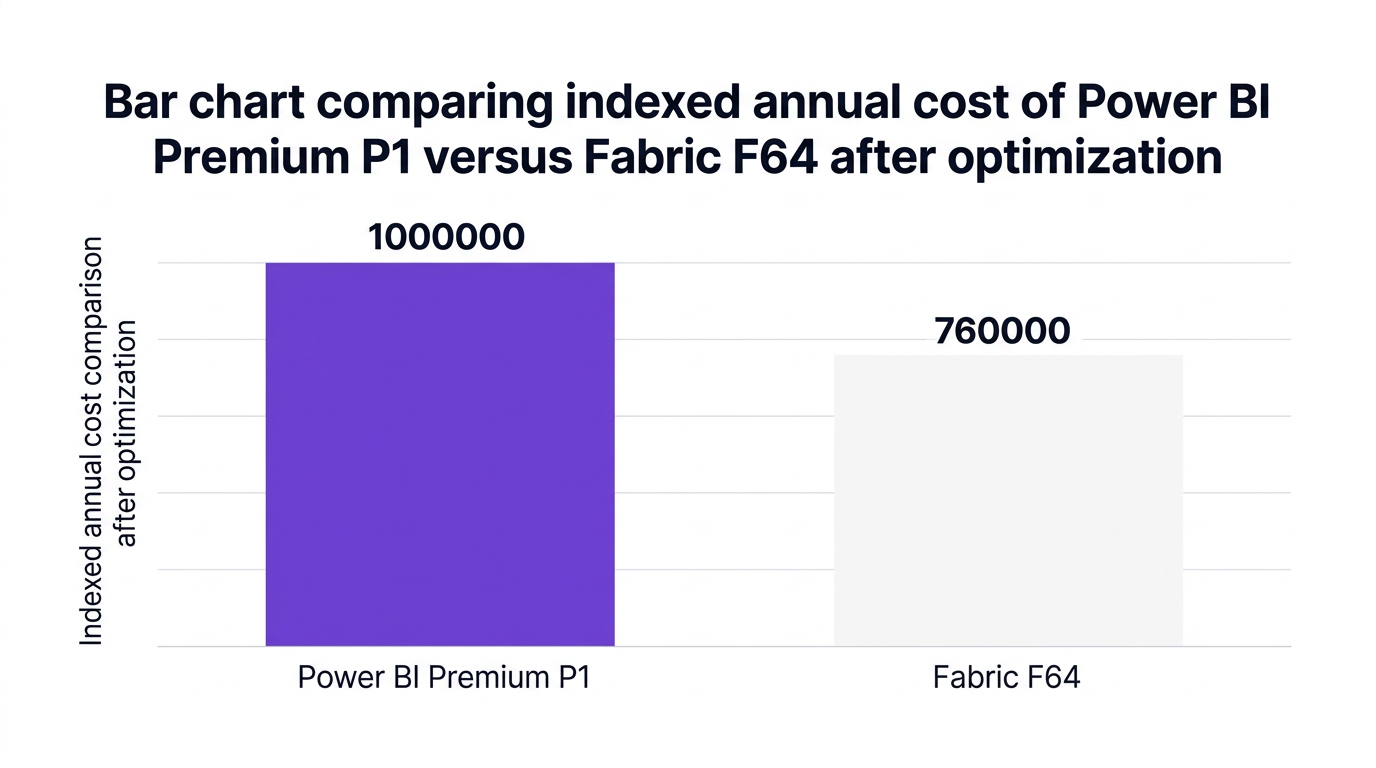
To ground the fabric vs premium cost discussion, most large organizations anchor on the common comparison: power bi premium p1 vs fabric f64 cost comparison. Analysts and Microsoft guidance commonly frame F64 as the successor tier for P1-like workloads.
Gartner’s 2026 reference scenario shows that for a typical enterprise deployment, annual spend indexed at 1,000,000 units on P1 can be reduced to roughly 760,000 units on F64 once concurrency and data lake usage are tuned. That equates to the 24 percent average savings figure.
When modeling p1 to f64 migration cost, finance and IT teams should break it into three layers:
In many environments, P1 capacity was sized for peak hour concurrency. Fabric F64 capacity can be sized closer to realistic peak, with more granular scaling options. A Forrester 2026 study notes that enterprises combining F-SKUs with reserved capacity and tuning patterns cut 21 percent of their monthly spend compared to on-demand equivalents.
Fabric typically wins on cost in scenarios where:
Analysts report that 20 to 30 percent savings are common once these optimizations are in place (Forrester 2026). That aligns with Gartner’s 24 percent benchmark and supports a strong power bi premium migration business case for CFO audiences.
Headline pricing only captures part of microsoft fabric migration costs for enterprises. Large organizations must model three additional categories: transition cost, operational change, and risk.

This includes planning, testing, and execution effort, plus any external partners or tools. IDC expects 87 percent of enterprise Power BI Premium customers to have started migration planning by May 2026 (IDC 2026), underlining the scale of project spend.
Common cost elements:
For large portfolios, this can equate to several person-months of work. Treat this like any structured fabric migration project plan from power bi premium, with clear milestones and budget.
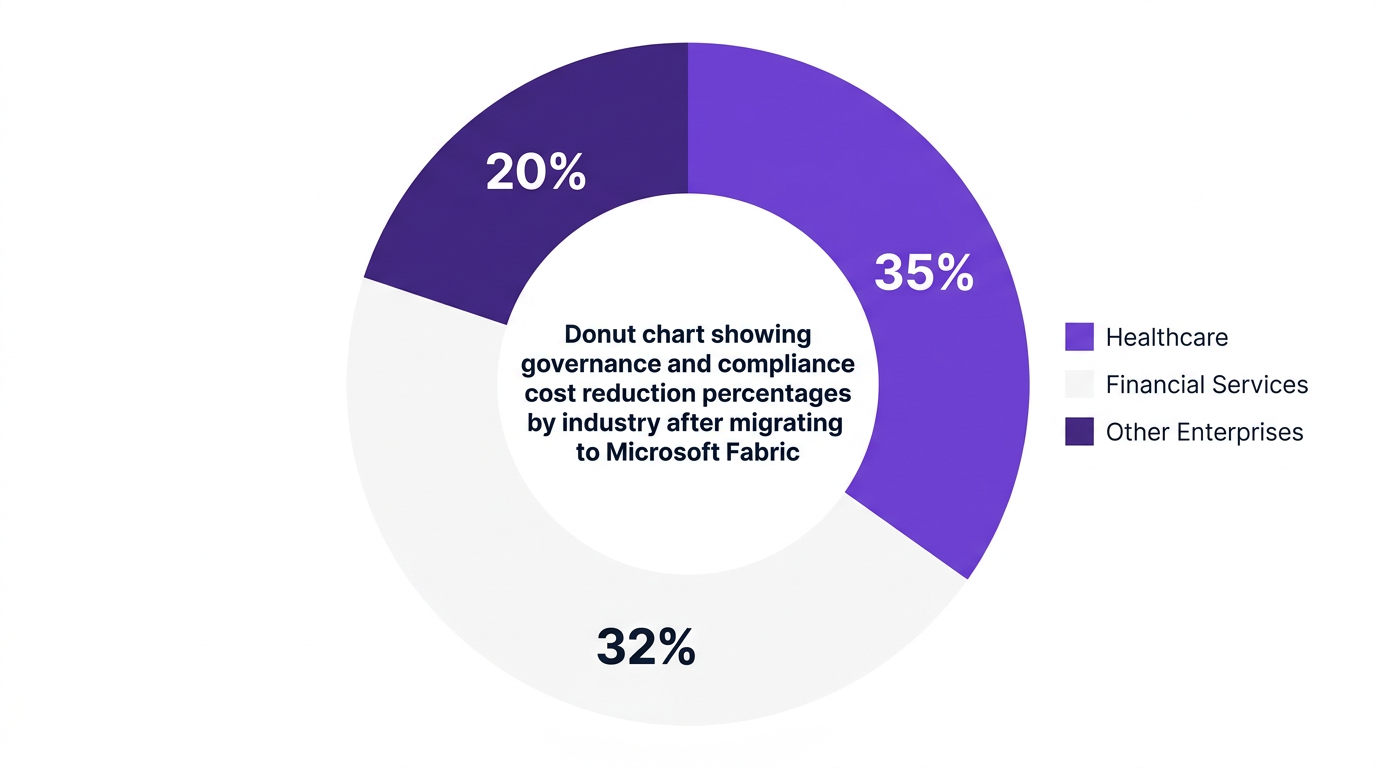
451 Research 2026 reports that healthcare and financial services organizations achieved up to 35 percent lower compliance-related costs after moving to Fabric, mainly due to unified auditing and role-based access controls.
That benefit is not automatic. 98 percent of IT leaders cite governance and license management complexity as a major barrier during Power BI to Fabric migration (ISG 2026). If you do not modernize governance in parallel, you risk:
Every large enterprise SaaS migration incurs risk: outages, performance regressions, or BI disruptions. These risks translate into cost through lost productivity or delayed decisions.
Mitigation tactics include:
Think of this like changing aircraft engines while in flight. You need redundancies and telemetry to keep the plane aloft.
To control power bi premium to fabric migration cost, organizations need a firm, repeatable process. Below is a pragmatic power bi premium to microsoft fabric migration guide aligned with FinOps best practices.
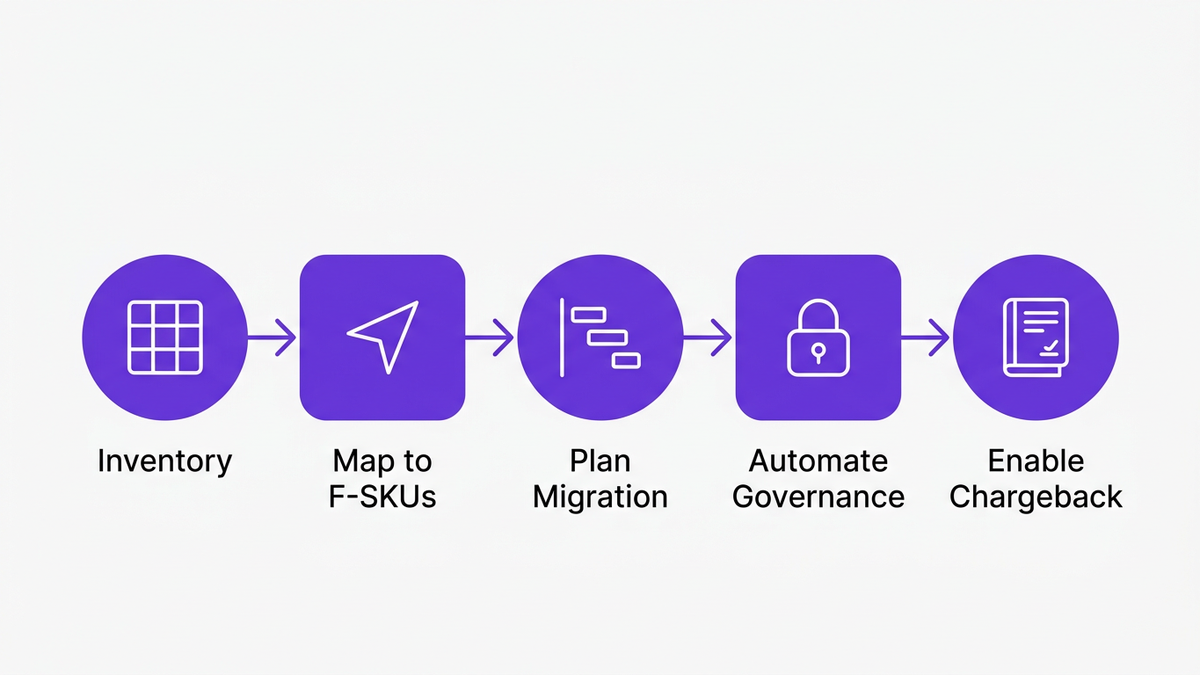
Start with complete visibility into:
This forms the basis for capacity planning and for a trustworthy microsoft fabric licensing and capacity calculator 2026 model. Without accurate baselines, F-SKU sizing quickly drifts into overprovisioning.
Use a structured P1 to F64 mapping:
For many enterprises, two or three right-sized F capacities can replace a larger number of underutilized P capacities, driving the microsoft fabric cost vs power bi premium delta.
Create a fabric migration project plan from power bi premium using phases:
At each phase, measure performance, utilization, and cost, and refine capacity allocations. Treat this as a feedback loop, not a one-time estimation.
Strong governance is crucial for cost and compliance. Align these controls early:
This is where governance automation and centralized SaaS management platforms become critical. They lower the hidden overhead that often inflates fabric migration cost management for enterprises.
A mature charged-back IT or showback model keeps departments accountable for their share of capacity. Fabric F-SKUs, with clearer utilization analytics, make this easier than P-SKUs when combined with FinOps practices.
You can:
This transparency sharpens decisions on where to invest or retire analytics workloads.
Even with a good initial model, fabric migration cost management for enterprises must be continuous. Think of your capacity plan like a living budget, not a static forecast.
Most organizations start with a microsoft fabric licensing and capacity calculator 2026 scenario that includes:
Validate the calculator against real monitoring data as soon as workloads reach Fabric. Adjust reserved capacity and sizing quarterly based on trends.
The heart of optimization is fabric capacity units vs power bi premium capacity cost:
Analogy: treat Fabric capacity like airline seats. Every empty seat on a flight still costs fuel. Your job is to fill seats with the right passengers (workloads) without overbooking.
Workload engineering has a direct impact on microsoft fabric vs power bi premium pricing 2026 outcomes:
Enterprises that treat these adjustments as a continuous FinOps practice see sustained microsoft fabric f-sku vs p-sku cost savings, rather than a one-time win.
A leading US financial services enterprise migrated from a portfolio of Power BI Premium P-SKUs to consolidated Fabric F-SKUs over three quarters, using CloudNuro as the governance and optimization backbone.
Using Microsoft 365 Custodian and Unified Cloud Custodian modules, the team:
The result was a 22 percent reduction in unused license costs and a 71 percent drop in manual governance workload (CloudNuro 2026). That freed IT and BI teams to focus on performance tuning and business outcomes, not spreadsheet-based license tracking.
This mirrors a broader trend: Gartner and Forrester both highlight that organizations connecting Fabric migration with structured SaaS management and FinOps practices realize 20 to 30 percent cost savings and improved compliance.
CloudNuro is built for complex, multi-phased migrations like power bi premium p-sku to fabric f-sku. Rather than treating Fabric as an isolated analytics project, CloudNuro brings it into a unified view of SaaS, cloud, and AI spend.
Here is how CloudNuro helps at each stage.
CloudNuro’s Microsoft 365 Custodian provides real-time discovery of existing Power BI Premium capacities, workspaces, and user access, along with usage analytics.
This gives IT and finance leaders the accurate baseline needed for:
Because CloudNuro integrates with 400 plus enterprise SaaS apps, you can see Fabric in the context of the broader Microsoft and SaaS ecosystem rather than as a standalone cost line.
The Unified Cloud Custodian module orchestrates governance across legacy Power BI and new Fabric environments.
CloudNuro automates:
This reduces the risk of orphaned privileges and compliance gaps that often surface during power bi premium retirement 2026 migration programs.
CloudNuro’s FinOps Services suite adds an operational layer on top of Fabric analytics:
Enterprises use CloudNuro to compare ongoing microsoft fabric cost vs power bi premium outcomes, ensuring that promised savings from F-SKUs are actually realized in monthly invoices.
You can learn more about CloudNuro’s approach to SaaS cost optimization and governance in the core platform overview on CloudNuro SaaS management and Microsoft license optimization.
The story does not end once P-SKUs are decommissioned. CloudNuro supports ongoing optimization through:
Combined with CloudNuro’s FinOps Services and IT asset visibility capabilities in IT asset management solutions, organizations create a repeatable discipline that protects microsoft fabric f-sku vs p-sku cost savings over time.
The power bi premium to fabric migration cost for a P1 to F64 move has two components: license deltas and project cost. On licensing alone, Gartner 2026 reports an average 24 percent reduction when moving from P-SKUs to equivalent F-SKUs and optimizing workloads.
Project costs vary based on portfolio size, but large enterprises often invest several person-months in planning, testing, and governance. Using tools like CloudNuro to automate discovery, access reviews, and right-sizing typically recovers that project cost within the first year of Fabric operation.
For most large deployments, yes, microsoft fabric vs power bi premium pricing 2026 comparisons favor Fabric when organizations consolidate capacities and use reserved options. Forrester 2026 notes that enterprises using reserved F-SKUs and capacity tuning average 21 percent monthly savings versus on-demand equivalents.
However, if you simply mirror P-SKU capacity into F-SKUs without consolidation or optimization, you may not see significant savings. Cost advantage requires active management of capacity units and workload design.
Power BI Premium P-SKUs were designed around dedicated BI capacity. Fabric F-SKUs provide unified capacity for multiple analytic workloads in one shared pool.
In pricing terms, this means:
These differences are why many organizations treat migration as an opportunity to adopt FinOps best practices instead of a pure SKU exchange.
By September 2026, P-SKUs are projected to be fully retired as an active model for enterprise use, with 87 percent of customers expected to have initiated migration planning or execution by May 2026 (IDC 2026).
Enterprises should:
Successful fabric migration cost management for enterprises centers on four practices:
Platforms like CloudNuro provide the visibility, automation, and financial governance needed to keep these practices running after initial migration.
CloudNuro is a leader in Enterprise SaaS Management Platforms, providing enterprises with unmatched visibility, governance, and cost optimization. Recognized twice in a row in the SaaS Management Platforms category and named a Leader in the SoftwareReviews Data Quadrant, CloudNuro is trusted by global enterprises and government agencies to bring financial discipline to SaaS, cloud, and AI. Trusted by enterprises such as Konica Minolta and Federal Signal, CloudNuro provides centralized SaaS inventory, license optimization, and renewal management along with advanced cost allocation and chargeback, giving IT and Finance leaders the visibility, control, and cost-conscious culture needed to drive financial discipline.
Request a no cost, no obligation free assessment —just 15 minutes to savings!
Get StartedFor many enterprises, the question is no longer if they will move from Power BI Premium P-SKUs to Fabric F-SKUs, but how to manage the power bi premium to fabric migration cost and operational impact. With P-SKU retirement nearing and Fabric emerging as the unified analytics platform, CIOs, IT finance, and data leaders must treat this as both a licensing shift and a structural modernization of analytics spend.
Gartner reports that enterprises moving to Fabric F-SKUs are seeing an average 24 percent cost reduction versus equivalent Power BI Premium P-SKUs once workloads are optimized (Gartner 2026). Yet 98 percent of IT leaders also say governance and license complexity is a major barrier during migration (ISG 2026). This walkthrough provides a practical, numbers-driven view of costs, the key differences between P and F models, and how to manage migration as a disciplined FinOps initiative.
Power BI Premium P-SKUs were built for dedicated BI capacity. Fabric F-SKUs, in contrast, cover a broader analytics fabric including BI, data engineering, data science, and more, with a unified capacity pool.
By September 2026, Power BI Premium P-SKUs are projected to be fully retired as a primary model, with 87 percent of customers already in planning or execution for migration by May 2026 (IDC 2026). That deadline forces enterprises to reassess not only license types but also capacity planning, chargeback models, and governance.
The retirement pressure can tempt teams to "lift and shift" P1 capacity to an equivalent F64 capacity without redesigning workloads. That is often the most expensive path. The smarter approach is to treat migration as an analytics modernization and cost-optimization project, not a one-for-one SKU replacement.
Two economic realities to consider:
Enterprises that use this inflection point to right-size typically see 21 percent lower monthly analytics platform expenditures through reserved F-SKU capacity (Forrester 2026).
To ground the fabric vs premium cost discussion, most large organizations anchor on the common comparison: power bi premium p1 vs fabric f64 cost comparison. Analysts and Microsoft guidance commonly frame F64 as the successor tier for P1-like workloads.
Gartner’s 2026 reference scenario shows that for a typical enterprise deployment, annual spend indexed at 1,000,000 units on P1 can be reduced to roughly 760,000 units on F64 once concurrency and data lake usage are tuned. That equates to the 24 percent average savings figure.
When modeling p1 to f64 migration cost, finance and IT teams should break it into three layers:
In many environments, P1 capacity was sized for peak hour concurrency. Fabric F64 capacity can be sized closer to realistic peak, with more granular scaling options. A Forrester 2026 study notes that enterprises combining F-SKUs with reserved capacity and tuning patterns cut 21 percent of their monthly spend compared to on-demand equivalents.
Fabric typically wins on cost in scenarios where:
Analysts report that 20 to 30 percent savings are common once these optimizations are in place (Forrester 2026). That aligns with Gartner’s 24 percent benchmark and supports a strong power bi premium migration business case for CFO audiences.
Headline pricing only captures part of microsoft fabric migration costs for enterprises. Large organizations must model three additional categories: transition cost, operational change, and risk.
This includes planning, testing, and execution effort, plus any external partners or tools. IDC expects 87 percent of enterprise Power BI Premium customers to have started migration planning by May 2026 (IDC 2026), underlining the scale of project spend.
Common cost elements:
For large portfolios, this can equate to several person-months of work. Treat this like any structured fabric migration project plan from power bi premium, with clear milestones and budget.
451 Research 2026 reports that healthcare and financial services organizations achieved up to 35 percent lower compliance-related costs after moving to Fabric, mainly due to unified auditing and role-based access controls.
That benefit is not automatic. 98 percent of IT leaders cite governance and license management complexity as a major barrier during Power BI to Fabric migration (ISG 2026). If you do not modernize governance in parallel, you risk:
Every large enterprise SaaS migration incurs risk: outages, performance regressions, or BI disruptions. These risks translate into cost through lost productivity or delayed decisions.
Mitigation tactics include:
Think of this like changing aircraft engines while in flight. You need redundancies and telemetry to keep the plane aloft.
To control power bi premium to fabric migration cost, organizations need a firm, repeatable process. Below is a pragmatic power bi premium to microsoft fabric migration guide aligned with FinOps best practices.
Start with complete visibility into:
This forms the basis for capacity planning and for a trustworthy microsoft fabric licensing and capacity calculator 2026 model. Without accurate baselines, F-SKU sizing quickly drifts into overprovisioning.
Use a structured P1 to F64 mapping:
For many enterprises, two or three right-sized F capacities can replace a larger number of underutilized P capacities, driving the microsoft fabric cost vs power bi premium delta.
Create a fabric migration project plan from power bi premium using phases:
At each phase, measure performance, utilization, and cost, and refine capacity allocations. Treat this as a feedback loop, not a one-time estimation.
Strong governance is crucial for cost and compliance. Align these controls early:
This is where governance automation and centralized SaaS management platforms become critical. They lower the hidden overhead that often inflates fabric migration cost management for enterprises.
A mature charged-back IT or showback model keeps departments accountable for their share of capacity. Fabric F-SKUs, with clearer utilization analytics, make this easier than P-SKUs when combined with FinOps practices.
You can:
This transparency sharpens decisions on where to invest or retire analytics workloads.
Even with a good initial model, fabric migration cost management for enterprises must be continuous. Think of your capacity plan like a living budget, not a static forecast.
Most organizations start with a microsoft fabric licensing and capacity calculator 2026 scenario that includes:
Validate the calculator against real monitoring data as soon as workloads reach Fabric. Adjust reserved capacity and sizing quarterly based on trends.
The heart of optimization is fabric capacity units vs power bi premium capacity cost:
Analogy: treat Fabric capacity like airline seats. Every empty seat on a flight still costs fuel. Your job is to fill seats with the right passengers (workloads) without overbooking.
Workload engineering has a direct impact on microsoft fabric vs power bi premium pricing 2026 outcomes:
Enterprises that treat these adjustments as a continuous FinOps practice see sustained microsoft fabric f-sku vs p-sku cost savings, rather than a one-time win.
A leading US financial services enterprise migrated from a portfolio of Power BI Premium P-SKUs to consolidated Fabric F-SKUs over three quarters, using CloudNuro as the governance and optimization backbone.
Using Microsoft 365 Custodian and Unified Cloud Custodian modules, the team:
The result was a 22 percent reduction in unused license costs and a 71 percent drop in manual governance workload (CloudNuro 2026). That freed IT and BI teams to focus on performance tuning and business outcomes, not spreadsheet-based license tracking.
This mirrors a broader trend: Gartner and Forrester both highlight that organizations connecting Fabric migration with structured SaaS management and FinOps practices realize 20 to 30 percent cost savings and improved compliance.
CloudNuro is built for complex, multi-phased migrations like power bi premium p-sku to fabric f-sku. Rather than treating Fabric as an isolated analytics project, CloudNuro brings it into a unified view of SaaS, cloud, and AI spend.
Here is how CloudNuro helps at each stage.
CloudNuro’s Microsoft 365 Custodian provides real-time discovery of existing Power BI Premium capacities, workspaces, and user access, along with usage analytics.
This gives IT and finance leaders the accurate baseline needed for:
Because CloudNuro integrates with 400 plus enterprise SaaS apps, you can see Fabric in the context of the broader Microsoft and SaaS ecosystem rather than as a standalone cost line.
The Unified Cloud Custodian module orchestrates governance across legacy Power BI and new Fabric environments.
CloudNuro automates:
This reduces the risk of orphaned privileges and compliance gaps that often surface during power bi premium retirement 2026 migration programs.
CloudNuro’s FinOps Services suite adds an operational layer on top of Fabric analytics:
Enterprises use CloudNuro to compare ongoing microsoft fabric cost vs power bi premium outcomes, ensuring that promised savings from F-SKUs are actually realized in monthly invoices.
You can learn more about CloudNuro’s approach to SaaS cost optimization and governance in the core platform overview on CloudNuro SaaS management and Microsoft license optimization.
The story does not end once P-SKUs are decommissioned. CloudNuro supports ongoing optimization through:
Combined with CloudNuro’s FinOps Services and IT asset visibility capabilities in IT asset management solutions, organizations create a repeatable discipline that protects microsoft fabric f-sku vs p-sku cost savings over time.
The power bi premium to fabric migration cost for a P1 to F64 move has two components: license deltas and project cost. On licensing alone, Gartner 2026 reports an average 24 percent reduction when moving from P-SKUs to equivalent F-SKUs and optimizing workloads.
Project costs vary based on portfolio size, but large enterprises often invest several person-months in planning, testing, and governance. Using tools like CloudNuro to automate discovery, access reviews, and right-sizing typically recovers that project cost within the first year of Fabric operation.
For most large deployments, yes, microsoft fabric vs power bi premium pricing 2026 comparisons favor Fabric when organizations consolidate capacities and use reserved options. Forrester 2026 notes that enterprises using reserved F-SKUs and capacity tuning average 21 percent monthly savings versus on-demand equivalents.
However, if you simply mirror P-SKU capacity into F-SKUs without consolidation or optimization, you may not see significant savings. Cost advantage requires active management of capacity units and workload design.
Power BI Premium P-SKUs were designed around dedicated BI capacity. Fabric F-SKUs provide unified capacity for multiple analytic workloads in one shared pool.
In pricing terms, this means:
These differences are why many organizations treat migration as an opportunity to adopt FinOps best practices instead of a pure SKU exchange.
By September 2026, P-SKUs are projected to be fully retired as an active model for enterprise use, with 87 percent of customers expected to have initiated migration planning or execution by May 2026 (IDC 2026).
Enterprises should:
Successful fabric migration cost management for enterprises centers on four practices:
Platforms like CloudNuro provide the visibility, automation, and financial governance needed to keep these practices running after initial migration.
CloudNuro is a leader in Enterprise SaaS Management Platforms, providing enterprises with unmatched visibility, governance, and cost optimization. Recognized twice in a row in the SaaS Management Platforms category and named a Leader in the SoftwareReviews Data Quadrant, CloudNuro is trusted by global enterprises and government agencies to bring financial discipline to SaaS, cloud, and AI. Trusted by enterprises such as Konica Minolta and Federal Signal, CloudNuro provides centralized SaaS inventory, license optimization, and renewal management along with advanced cost allocation and chargeback, giving IT and Finance leaders the visibility, control, and cost-conscious culture needed to drive financial discipline.
Request a no cost, no obligation free assessment - just 15 minutes to savings!
Get StartedWe're offering complimentary ServiceNow license assessments to only 25 enterprises this quarter who want to unlock immediate savings without disrupting operations.
Get Free AssessmentGet Started


CloudNuro Corp
1755 Park St. Suite 207
Naperville, IL 60563
Phone : +1-630-277-9470
Email: info@cloudnuro.com


.webp)

Recognized Leader in SaaS Management Platforms by Info-Tech SoftwareReviews


%20Critical%20in%202025.png)