

Sign Up
Thank you for Submitting!

Enterprise data platforms are concentrating larger portions of the cloud software budget into unified capacity models. This structural shift elevates the need to closely track utilization anomalies across shared data warehouses, machine learning pipelines, and business intelligence suites. Organizations are accelerating cross functional alignment between IT and finance leadership, establishing joint operational committees to govern analytics capacity budgets that were previously managed in isolation. Effectively managing these capacity driven platform costs requires categorizing workloads properly. By separating exploratory analysis from high concurrency enterprise dashboards, organizations can map each specific category to the minimum viable module to prevent unnecessary over provisioning.
When organizations benchmark comprehensive environments, understanding the precise nuances of fabric sku pricing becomes a primary financial initiative. Leadership needs transparent visibility into real monthly dollar examples to establish accurate showback reporting. This comprehensive guide outlines the exact cost structures from the entry level through the global enterprise tiers, empowering procurement commands to optimize cloud spending efficiently.
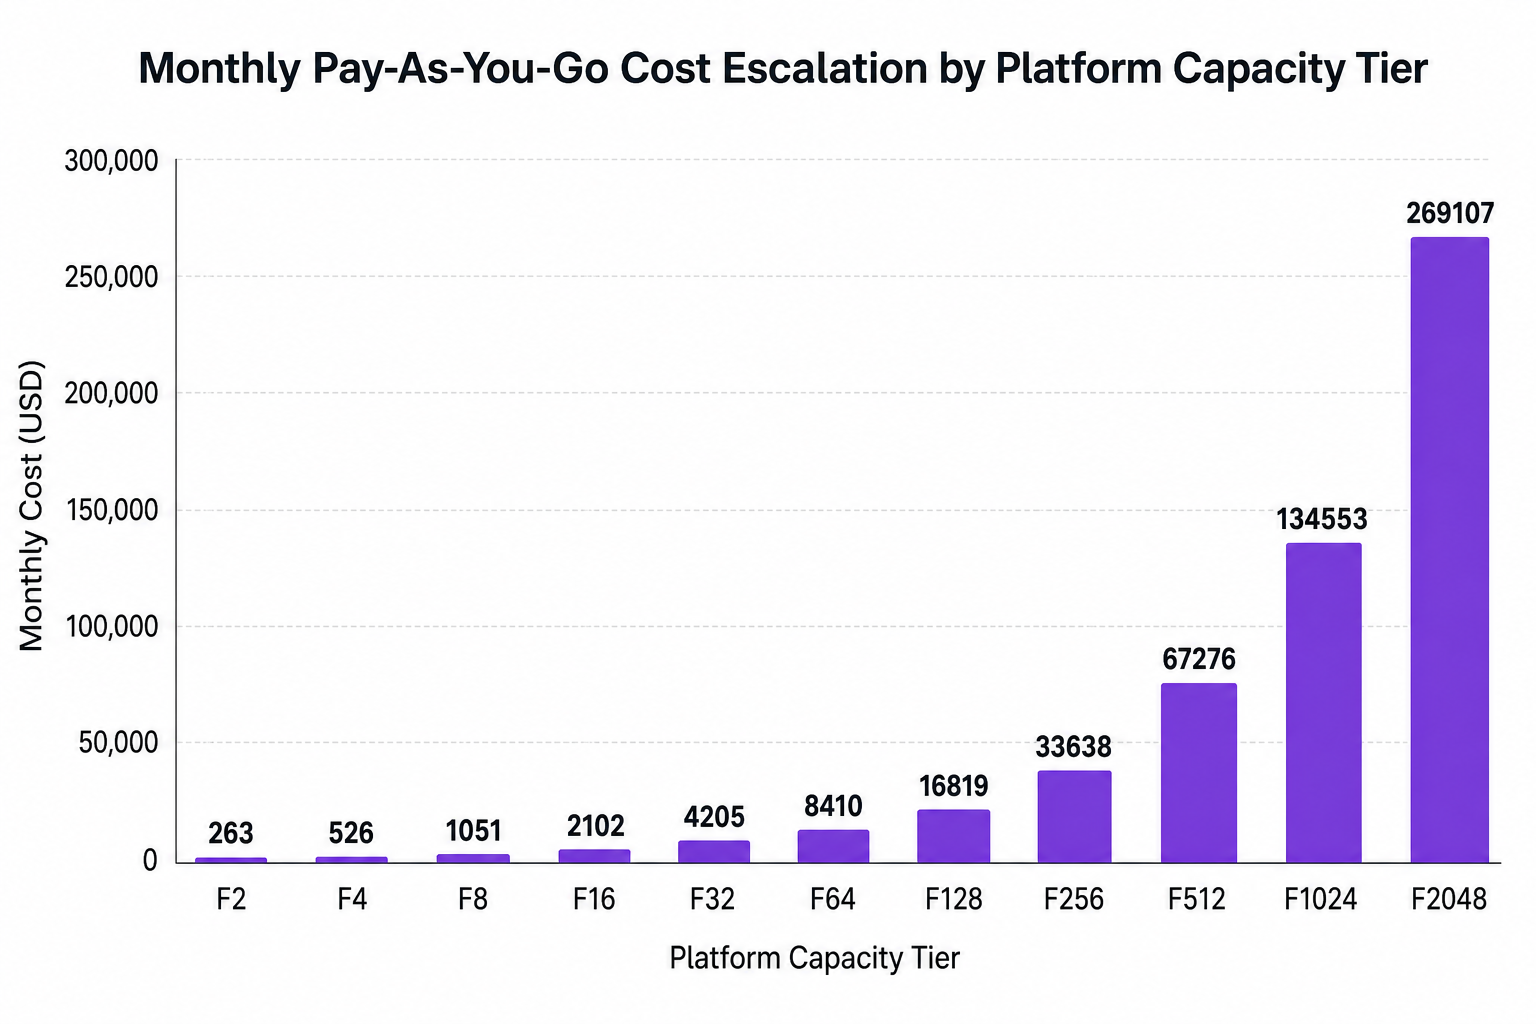
The fundamental architecture of modern cloud analytics licensing relies on capacity units rather than individual user seats. In these environments, compute power and memory run as a singular pooled resource that multiple business units draw from simultaneously. The baseline cost for the entry level F2 capacity tier sits at approximately $263 per month on a pay as you go model. From this baseline, costs scale linearly by exactly doubling at each successive SKU tier up to approximately $269,107 per month for the massive F2048 tier.
Financial advantages exist for teams that can forecast their consumption accurately. Leveraging 1 year reserved capacity commitments reduces the monthly bill rate by approximately 41 percent compared to standard on demand compute rates. However, establishing functional chargeback models is essential to alter business unit behavior and maximize these discounts. Without directly linking underlying compute capacity costs to the teams consuming them, centralized IT groups remain saddled with unpredictable baseline expense growth.
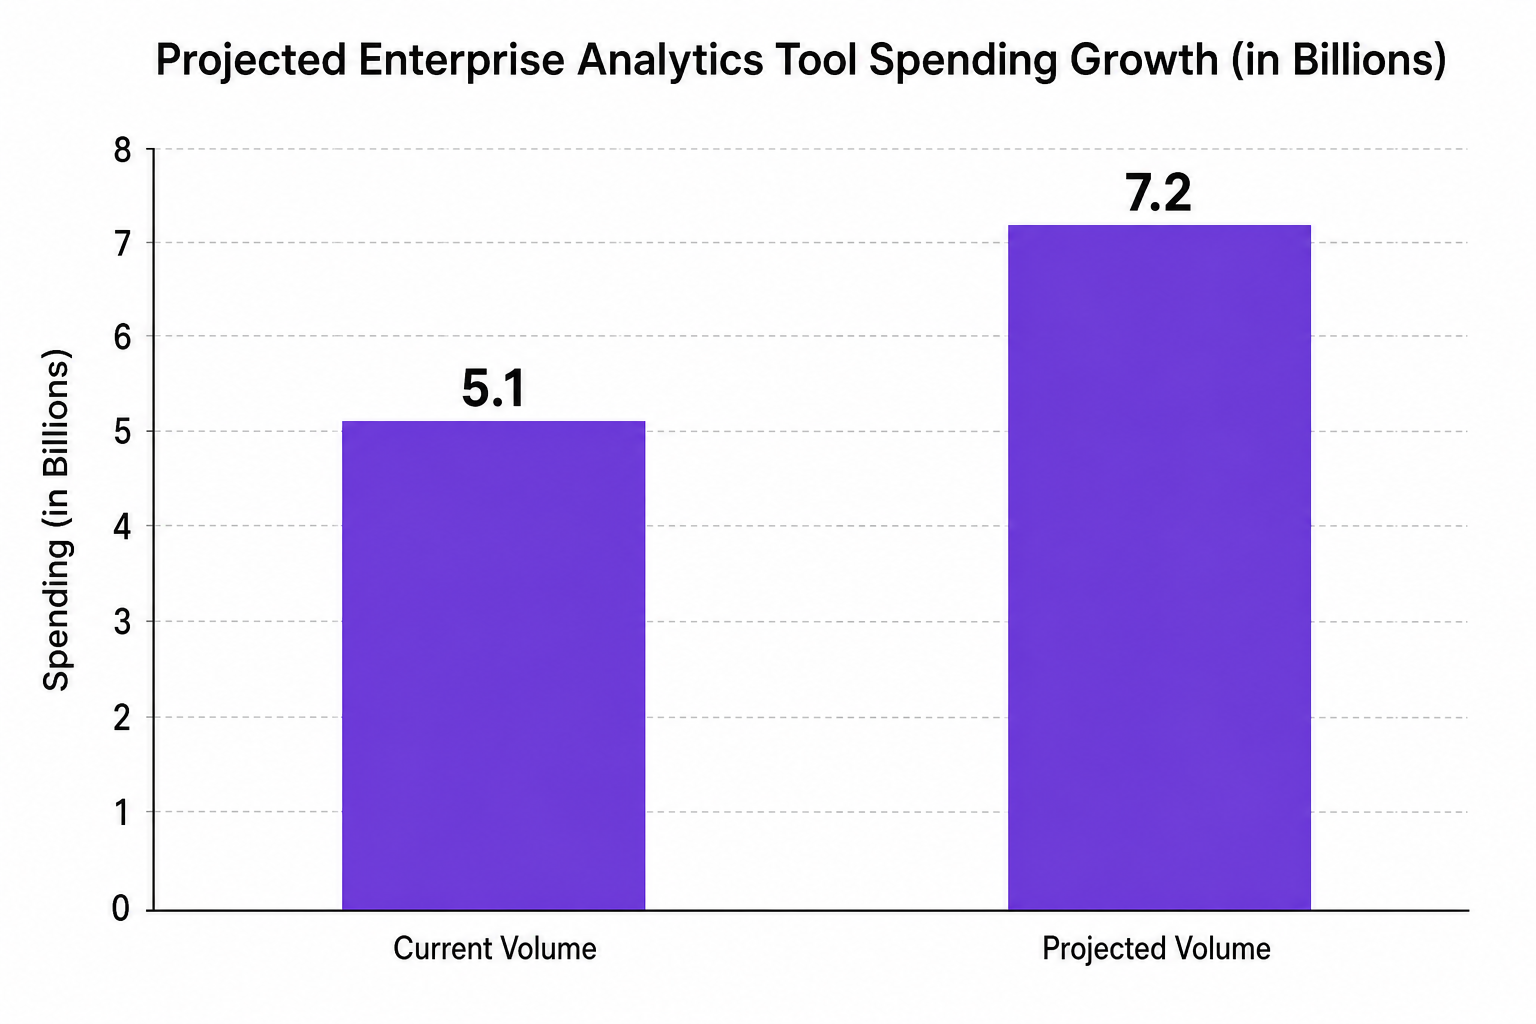
Enterprise spending on comprehensive data and analytics tools is projected to climb by 28 percent year over year, tracking toward a 7.2 billion market footprint. Evaluating the linear progression of real monthly costs provides a clear framework for budget projection and technical roadmap planning.
The development and departmental tiers range from F2 to F32. At F2, the $263 monthly rate supports foundational data testing and isolated exploratory analysis. The F4 tier doubles this capability for $526, while F8 reaches $1,051 per month. By the time computational needs hit the F16 and F32 modules, monthly costs reach $2,102 and $4,205 respectively. These mid market limits easily support robust departmental dashboards and daily operational reporting.
Advancing into enterprise production workloads covers the F64 through F256 tiers. The F64 module operates at $8,410 per month, serving robust transactional demands. Demanding heavy ingestion schedules pushes requirements into F128 at $16,819 and F256 at $33,638. These tiers process complex machine learning models across broad enterprise teams.
Extreme scale global infrastructure demands the F512, F1024, and F2048 increments. Moving from $67,276 at F512 to $134,553 at F1024 handles nearly unlimited concurrency. The ultimate compute environment at F2048 demands $269,107 monthly, designed solely for multinational operations processing petabytes of continuous streaming data.
Transitioning to capacity models introduces significant operational challenges. Over 74 percent of large enterprises report that native capacity tracking metrics lack the financial context necessary to execute actionable budget control and cost attribution. When native tracking metrics fail to link specific virtual environments to human owners, financial leakage accelerates unnoticed.
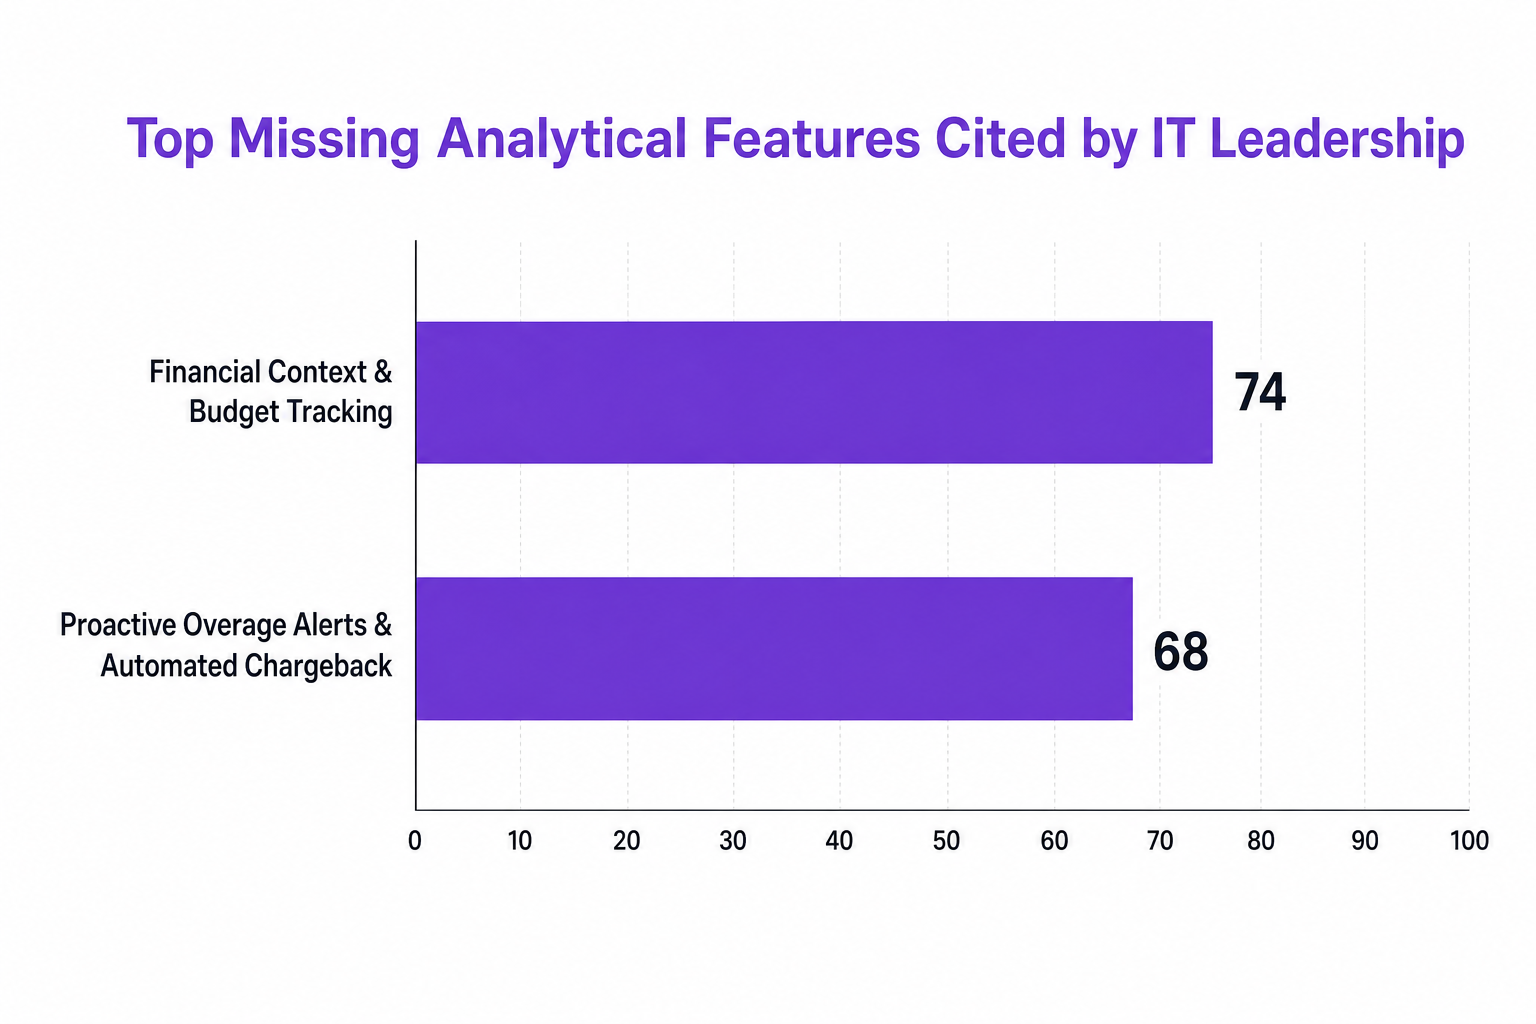
The market is moving away from manual spreadsheet based software audits toward continuous optimization programs. Relying on manual intervention typically results in uncontrolled baseline cost drift. Missing automated overage alerts and systemic chargeback features are cited as the primary operational pain points by 68 percent of IT leaders managing analytics expenditures. Deploying optimization in isolation often ignores systemic inefficiencies. Optimizing a single analytics platform without reviewing parallel data integration pipelines or overlapping intelligence apps severely limits the net financial impact on the overall digital estate.
Organizations heavily adopt standard workload tagging and metadata enforcement at the point of provisioning to enable automated, highly granular chargeback and showback reporting across decentralized business units. Through these standardized tagging policies, cost centers assume direct accountability for the data workloads they initiate.
Organizations utilizing automated optimization to right size environments and retrieve idle allocations observe a median spend reduction of 31 percent on their analytics budgets. To achieve these metrics, enterprises leverage robust software management capabilities to deploy automated orchestration workflows that automatically scale down capacity tiers or pause non critical data environments during off peak hours and weekends to prevent continuous run rate waste.
CloudNuro's FinOps Services empower finance executives and procurement teams to analyze thousands of overlapping users to build renewal ready data rooms. These detailed analytics translate exact historical usage metrics into highly optimized reserved capacity tiers. The Microsoft 365 Custodian effectively neutralizes native tracking limitations by linking specific capacity spikes directly to distinct financial cost centers, giving leadership exact operational visibility over their heaviest workloads.
Continuous telemetry across cloud ecosystems maps active capacity units and assigned licenses back to specific users, groups, and departmental budgets. Unified Cloud Custodian centralizes governance by tracking advanced analytics consumption in a single dashboard alongside broader cloud databases, virtual infrastructure, and hundreds of supported applications. Administrators configure proactive overage guards that instantly trigger alerts based on defined budget threshold crossings or sudden consumption anomalies.
Implementing structured SaaS pricing benchmarks combined with advanced governance frameworks produces immediate financial returns. The automated identification systems detect inactive or low value user patterns, triggering policy driven license reclamation workflows to downgrade or completely remove access after defined intervals.
A global pharmaceutical enterprise integrated unified cloud governance platforms to track capacity consumption, achieving a 36 percent reduction in overage costs while successfully automating chargeback reporting across 27 operational departments. Similarly, a Fortune 500 healthcare enterprise implemented artificial intelligence based optimization programs to govern analytics provisioning, simultaneously reducing annual software spend by 19 percent and cutting orphaned licenses by 32 percent.
Cost allocation engines use customized tags and project codes to automatically attribute computing usage to the correct business units. This engine generates reliable showback statements that finance teams can validate effortlessly. A large financial services firm cut software renewal costs by 44 percent through predictive analytics and tight license scenario modeling, completely avoiding premium tier over purchasing. Even on the virtual machine level, a large transportation enterprise reclaimed 1,700 unused environment licenses, optimized over 35 virtual compute footprints, and generated roughly 300 annual operational hours in pure efficiency gains.
As enterprise analytical demands scale upward, securing complete operational transparency through intelligent FinOps management guarantees that cloud investments deliver maximum strategic productivity without incurring baseline waste.
The financial difference represents a perfectly linear scaling module. Starting from a baseline pay as you go rate of approximately $263 per month for the F2 environment, the cost exactly doubles with each tier increase. It reaches approximately $269,107 per month for the highest global enterprise F2048 environment.
Compute environments are priced based on the total allocation of capacity units. When capacity naturally doubles to handle heavier processing tasks or higher concurrent user volumes, the monthly billing requirement increases in direct proportion. Organizations can optimize this escalating curve by leveraging one year reserved commitments rather than executing purely on demand rates.
The F8 tier sits at $1,051 monthly to address growing departmental reporting. Advancing to F32 costs $4,205 per month. High performance enterprise workloads typically sit around the F64 tier at $8,410 or the F128 tier at $16,819. Massive instances like the F512 demand $67,276 each month.
Optimal value depends entirely on accurately categorizing active workloads. Entry level tiers supply strong value for isolated data science validation operations. Meanwhile, mid level categories present the strongest value to secure consistent execution for broad departmental business intelligence dashboards. Separating exploratory testing from structural reporting allows enterprises to match exact requirements to precise modules.
The core distinction among these modules rests in computation volume, query speed, and total operational concurrency rather than locked software capabilities. Organizations transition into higher pricing tiers specifically when their underlying data transformation volumes expand naturally or when a larger magnitude of simultaneous analysts begin initiating complex analytical queries at the same moment.
About CloudNuro
CloudNuro is a leader in Enterprise AI Adoption Management, providing enterprises with unmatched visibility, governance, and cost optimization. Recognized twice in a row in the SaaS Management Platforms category and named a Leader in the SoftwareReviews Data Quadrant, CloudNuro is trusted by global enterprises and government agencies to bring financial discipline to SaaS, cloud, and AI. Trusted by enterprises such as Konica Minolta and Federal Signal, CloudNuro provides centralized SaaS inventory, license optimization, and renewal management along with advanced cost allocation and chargeback, giving IT and Finance leaders the visibility, control, and cost-conscious culture needed to drive financial discipline.
Request a no cost, no obligation free assessment —just 15 minutes to savings!
Get StartedEnterprise data platforms are concentrating larger portions of the cloud software budget into unified capacity models. This structural shift elevates the need to closely track utilization anomalies across shared data warehouses, machine learning pipelines, and business intelligence suites. Organizations are accelerating cross functional alignment between IT and finance leadership, establishing joint operational committees to govern analytics capacity budgets that were previously managed in isolation. Effectively managing these capacity driven platform costs requires categorizing workloads properly. By separating exploratory analysis from high concurrency enterprise dashboards, organizations can map each specific category to the minimum viable module to prevent unnecessary over provisioning.
When organizations benchmark comprehensive environments, understanding the precise nuances of fabric sku pricing becomes a primary financial initiative. Leadership needs transparent visibility into real monthly dollar examples to establish accurate showback reporting. This comprehensive guide outlines the exact cost structures from the entry level through the global enterprise tiers, empowering procurement commands to optimize cloud spending efficiently.
The fundamental architecture of modern cloud analytics licensing relies on capacity units rather than individual user seats. In these environments, compute power and memory run as a singular pooled resource that multiple business units draw from simultaneously. The baseline cost for the entry level F2 capacity tier sits at approximately $263 per month on a pay as you go model. From this baseline, costs scale linearly by exactly doubling at each successive SKU tier up to approximately $269,107 per month for the massive F2048 tier.
Financial advantages exist for teams that can forecast their consumption accurately. Leveraging 1 year reserved capacity commitments reduces the monthly bill rate by approximately 41 percent compared to standard on demand compute rates. However, establishing functional chargeback models is essential to alter business unit behavior and maximize these discounts. Without directly linking underlying compute capacity costs to the teams consuming them, centralized IT groups remain saddled with unpredictable baseline expense growth.
Enterprise spending on comprehensive data and analytics tools is projected to climb by 28 percent year over year, tracking toward a 7.2 billion market footprint. Evaluating the linear progression of real monthly costs provides a clear framework for budget projection and technical roadmap planning.
The development and departmental tiers range from F2 to F32. At F2, the $263 monthly rate supports foundational data testing and isolated exploratory analysis. The F4 tier doubles this capability for $526, while F8 reaches $1,051 per month. By the time computational needs hit the F16 and F32 modules, monthly costs reach $2,102 and $4,205 respectively. These mid market limits easily support robust departmental dashboards and daily operational reporting.
Advancing into enterprise production workloads covers the F64 through F256 tiers. The F64 module operates at $8,410 per month, serving robust transactional demands. Demanding heavy ingestion schedules pushes requirements into F128 at $16,819 and F256 at $33,638. These tiers process complex machine learning models across broad enterprise teams.
Extreme scale global infrastructure demands the F512, F1024, and F2048 increments. Moving from $67,276 at F512 to $134,553 at F1024 handles nearly unlimited concurrency. The ultimate compute environment at F2048 demands $269,107 monthly, designed solely for multinational operations processing petabytes of continuous streaming data.
Transitioning to capacity models introduces significant operational challenges. Over 74 percent of large enterprises report that native capacity tracking metrics lack the financial context necessary to execute actionable budget control and cost attribution. When native tracking metrics fail to link specific virtual environments to human owners, financial leakage accelerates unnoticed.
The market is moving away from manual spreadsheet based software audits toward continuous optimization programs. Relying on manual intervention typically results in uncontrolled baseline cost drift. Missing automated overage alerts and systemic chargeback features are cited as the primary operational pain points by 68 percent of IT leaders managing analytics expenditures. Deploying optimization in isolation often ignores systemic inefficiencies. Optimizing a single analytics platform without reviewing parallel data integration pipelines or overlapping intelligence apps severely limits the net financial impact on the overall digital estate.
Organizations heavily adopt standard workload tagging and metadata enforcement at the point of provisioning to enable automated, highly granular chargeback and showback reporting across decentralized business units. Through these standardized tagging policies, cost centers assume direct accountability for the data workloads they initiate.
Organizations utilizing automated optimization to right size environments and retrieve idle allocations observe a median spend reduction of 31 percent on their analytics budgets. To achieve these metrics, enterprises leverage robust software management capabilities to deploy automated orchestration workflows that automatically scale down capacity tiers or pause non critical data environments during off peak hours and weekends to prevent continuous run rate waste.
CloudNuro's FinOps Services empower finance executives and procurement teams to analyze thousands of overlapping users to build renewal ready data rooms. These detailed analytics translate exact historical usage metrics into highly optimized reserved capacity tiers. The Microsoft 365 Custodian effectively neutralizes native tracking limitations by linking specific capacity spikes directly to distinct financial cost centers, giving leadership exact operational visibility over their heaviest workloads.
Continuous telemetry across cloud ecosystems maps active capacity units and assigned licenses back to specific users, groups, and departmental budgets. Unified Cloud Custodian centralizes governance by tracking advanced analytics consumption in a single dashboard alongside broader cloud databases, virtual infrastructure, and hundreds of supported applications. Administrators configure proactive overage guards that instantly trigger alerts based on defined budget threshold crossings or sudden consumption anomalies.
Implementing structured SaaS pricing benchmarks combined with advanced governance frameworks produces immediate financial returns. The automated identification systems detect inactive or low value user patterns, triggering policy driven license reclamation workflows to downgrade or completely remove access after defined intervals.
A global pharmaceutical enterprise integrated unified cloud governance platforms to track capacity consumption, achieving a 36 percent reduction in overage costs while successfully automating chargeback reporting across 27 operational departments. Similarly, a Fortune 500 healthcare enterprise implemented artificial intelligence based optimization programs to govern analytics provisioning, simultaneously reducing annual software spend by 19 percent and cutting orphaned licenses by 32 percent.
Cost allocation engines use customized tags and project codes to automatically attribute computing usage to the correct business units. This engine generates reliable showback statements that finance teams can validate effortlessly. A large financial services firm cut software renewal costs by 44 percent through predictive analytics and tight license scenario modeling, completely avoiding premium tier over purchasing. Even on the virtual machine level, a large transportation enterprise reclaimed 1,700 unused environment licenses, optimized over 35 virtual compute footprints, and generated roughly 300 annual operational hours in pure efficiency gains.
As enterprise analytical demands scale upward, securing complete operational transparency through intelligent FinOps management guarantees that cloud investments deliver maximum strategic productivity without incurring baseline waste.
The financial difference represents a perfectly linear scaling module. Starting from a baseline pay as you go rate of approximately $263 per month for the F2 environment, the cost exactly doubles with each tier increase. It reaches approximately $269,107 per month for the highest global enterprise F2048 environment.
Compute environments are priced based on the total allocation of capacity units. When capacity naturally doubles to handle heavier processing tasks or higher concurrent user volumes, the monthly billing requirement increases in direct proportion. Organizations can optimize this escalating curve by leveraging one year reserved commitments rather than executing purely on demand rates.
The F8 tier sits at $1,051 monthly to address growing departmental reporting. Advancing to F32 costs $4,205 per month. High performance enterprise workloads typically sit around the F64 tier at $8,410 or the F128 tier at $16,819. Massive instances like the F512 demand $67,276 each month.
Optimal value depends entirely on accurately categorizing active workloads. Entry level tiers supply strong value for isolated data science validation operations. Meanwhile, mid level categories present the strongest value to secure consistent execution for broad departmental business intelligence dashboards. Separating exploratory testing from structural reporting allows enterprises to match exact requirements to precise modules.
The core distinction among these modules rests in computation volume, query speed, and total operational concurrency rather than locked software capabilities. Organizations transition into higher pricing tiers specifically when their underlying data transformation volumes expand naturally or when a larger magnitude of simultaneous analysts begin initiating complex analytical queries at the same moment.
About CloudNuro
CloudNuro is a leader in Enterprise AI Adoption Management, providing enterprises with unmatched visibility, governance, and cost optimization. Recognized twice in a row in the SaaS Management Platforms category and named a Leader in the SoftwareReviews Data Quadrant, CloudNuro is trusted by global enterprises and government agencies to bring financial discipline to SaaS, cloud, and AI. Trusted by enterprises such as Konica Minolta and Federal Signal, CloudNuro provides centralized SaaS inventory, license optimization, and renewal management along with advanced cost allocation and chargeback, giving IT and Finance leaders the visibility, control, and cost-conscious culture needed to drive financial discipline.
Request a no cost, no obligation free assessment - just 15 minutes to savings!
Get StartedWe're offering complimentary ServiceNow license assessments to only 25 enterprises this quarter who want to unlock immediate savings without disrupting operations.
Get Free AssessmentGet Started




CloudNuro Corp
1755 Park St. Suite 207
Naperville, IL 60563
Phone : +1-630-277-9470
Email: info@cloudnuro.com





.webp)

Recognized Leader in SaaS Management Platforms by Info-Tech SoftwareReviews




.svg)