

Sign Up
Thank you for Submitting!
Today’s enterprise analytics leaders face an unfamiliar paradox. Microsoft’s analytics stack offers both Microsoft Fabric, a powerful, unified analytics platform, and Power BI, the long-standing business intelligence standard. As organizations modernize the data stack, most find they aren't picking between the two, but unlocking greater value by knowing exactly when and how to use both in tandem.
This guide unpacks the real differences between Microsoft Fabric and Power BI, explains the capacity metrics that drive both cost and reporting performance, and explores best practices to monitor capacity and optimize spend. For IT, Finance, and analytics leaders, the right approach ensures cost control, governance, and true reporting agility.

Microsoft Fabric is the analytics foundation. It unites data engineering, data warehousing, data science, and real-time analytics into a single SaaS platform. Power BI is the visualization and reporting layer, the familiar window most users see. Fabric delivers the storage, compute, and transformation muscle, while Power BI orchestrates insight delivery for business users.
Some organizations run Power BI on its own; others now leverage Fabric as their central analytics hub. Increasingly, most use both, sometimes without even realizing it, as Microsoft blends their experiences.
| Feature | Microsoft Fabric | Power BI |
|---|---|---|
| Core Purpose | Unified Analytics Stack | BI/Visualization Front |
| Primary Users | Data Engineers, IT | Business Analysts |
| Capacity Model | Fabric SKUs (F) | Power BI Premium (P/E) |
| Key Metrics to Track | Capacity Units, GCUs | Workspace, Refresh |
| License Complexity | High (multi-workload) | Medium |
| Governance Need | High | Moderate |
Expert Insight:
"Microsoft Fabric is the foundation, while Power BI is the window; they are complementary solutions where the unified platform supercharges reporting rather than replacing it."
Clarity begins with use cases and workload profiles:
Microsoft Fabric:
Power BI:
Using Both (the New Normal):
Market Reality:
Whether using Fabric, Power BI, or both, capacity is the critical control point. Picking the wrong capacity SKU or failing to monitor usage leads directly to overspend, throttled reports, or compliance violations.
Key Statistic: Up to 40% of Microsoft Fabric customers are currently overprovisioned due to a lack of actionable visibility.
Key Fabric Capacity Metrics:
The capacity chapter is evolving:
Capacity Optimization Realities
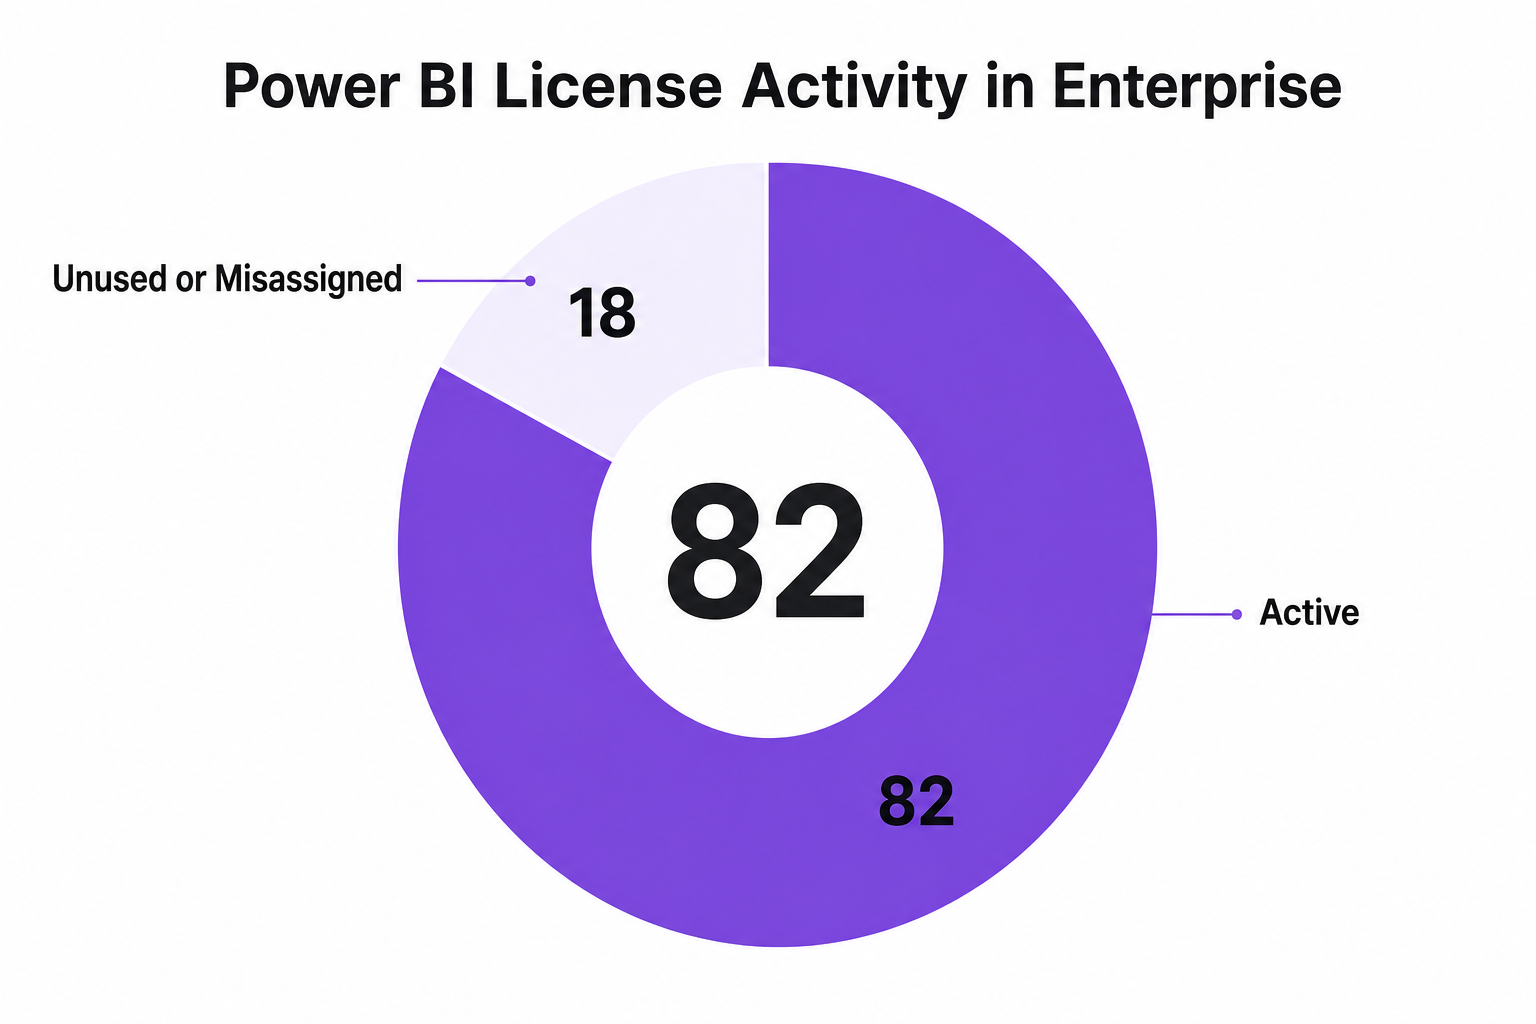
Modern capacity management means more than viewing a dashboard. You need visibility down to the department, project, and workload; timely alerts on spikes; and proactive policies that prevent dual-running costs during migration.
Common Questions IT and Finance Teams Face:
CloudNuro helps by providing:
Proof of Value:
Modern enterprise teams should build a practice around four core principles:
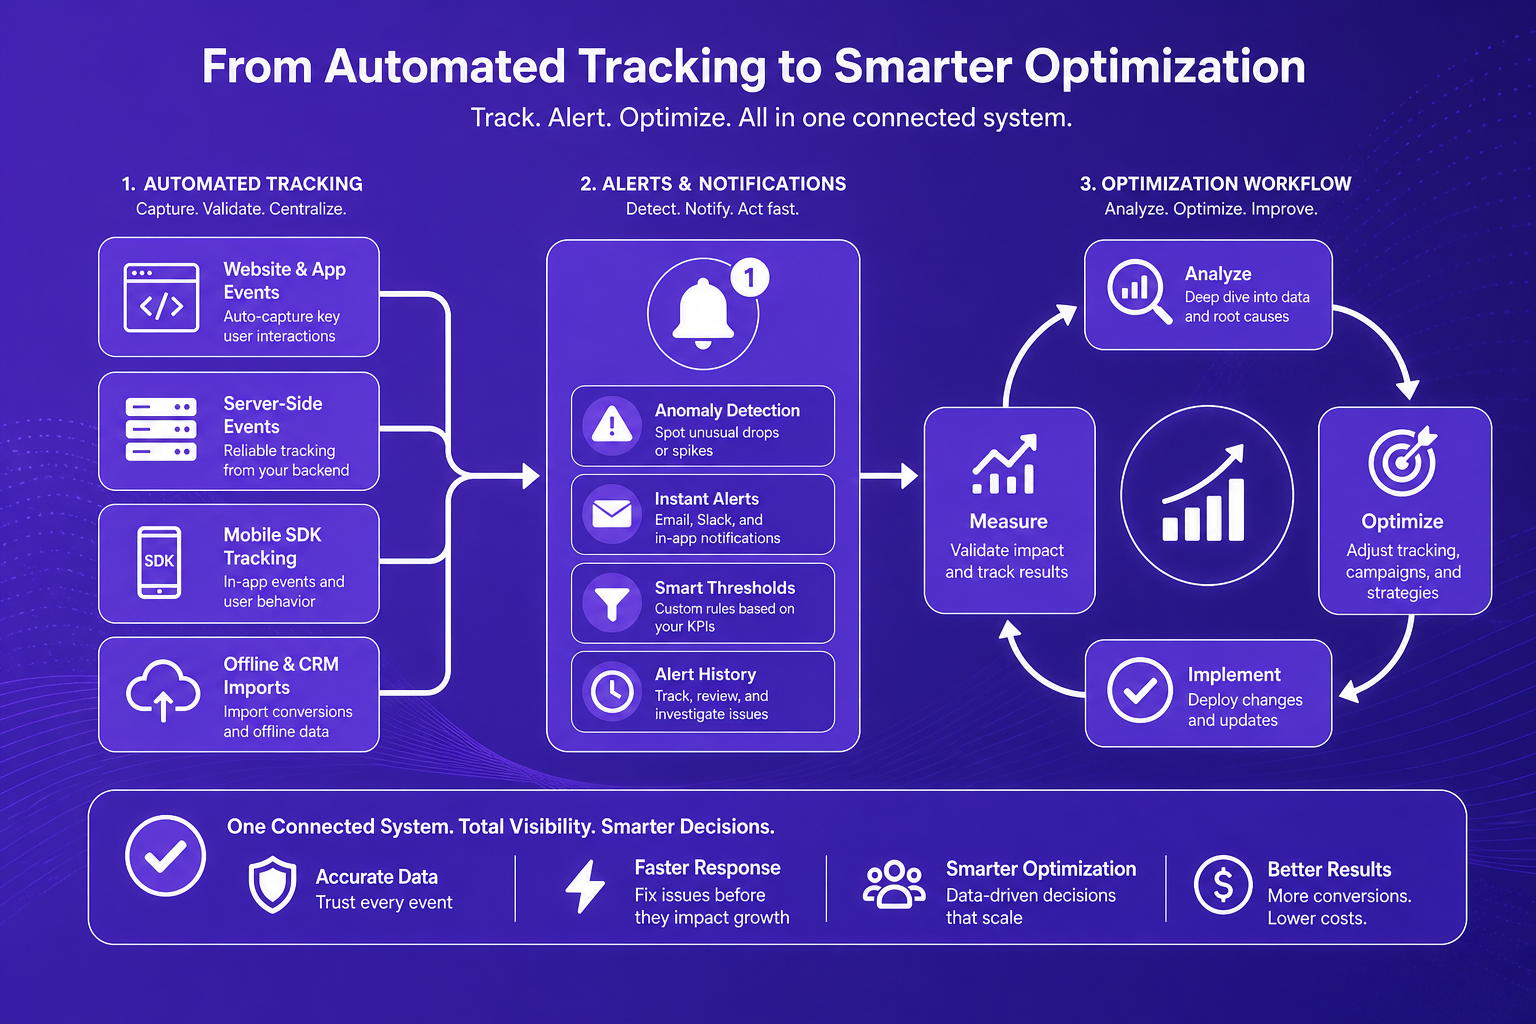
Instead of relying on snapshots, automate continuous inventory of capacity units, license usage, and feature adoption for both platforms. This prevents data leakage and budget creep.
Implement intelligent workflows to continuously review and deprovision underused or orphaned licenses. This drives instant cost savings and tightens governance.
Use platforms (such as CloudNuro) that natively map capacity consumption for chargeback and showback, enforcing accountability for every unit of spend.
Timely alerts for spikes in refreshes, excessive capacity consumption, or unusual user activity let teams act proactively, not reactively.
Expert Insight:
"Successful optimization requires continuous visibility and automation rather than a one-time migration, as dynamic capacity models demand proactive governance to prevent budget drains."
CloudNuro’s AI-enabled SaaS operations platform sits at the intersection of governance, cost optimization, and analytics modernization. With end-to-end visibility across Microsoft Fabric, Power BI, and an ecosystem of 400+ data sources, CloudNuro enables IT and Finance teams to:
Leaders in healthcare, finance, government, and large enterprises trust CloudNuro to bridge the visibility and optimization gap as they migrate and modernize analytics platforms.
What is the difference between Microsoft Fabric and Power BI?
Microsoft Fabric is a unified analytics platform supporting data engineering, science, and storage, while Power BI serves as the business intelligence and visualization front-end. Fabric is about back-end data prep and compute; Power BI focuses on self-service reporting for business users.
When should I use Microsoft Fabric over Power BI?
Choose Fabric for complex or large-scale analytics, multi-source integration, advanced machine learning, or when granular governance and chargeback is required. Use Power BI for rapidly building and sharing interactive reports and dashboards, especially when advanced data prep is not needed.
How do fabric capacity metrics impact reporting?
Fabric capacity units determine how much compute and storage your workloads can use, impacting dashboard refresh times, concurrency, and overall reporting reliability. Poor capacity monitoring risks slow reports or unexpected costs.
Can you monitor capacity KPIs in both Microsoft Fabric and Power BI?
Yes. Capacity KPIs such as usage, spikes, concurrency, and orphaned licenses can and should be monitored across both platforms. Platforms like CloudNuro extend native capabilities by offering deeper, automated tracking and reporting.
What are best practices for fabric capacity monitoring?
Automate capacity tracking, set proactive alerts, continuously review license usage, and allocate costs at the department or project level. Governance and automation are key to ongoing optimization.
Organizations no longer need to choose between Microsoft Fabric and Power BI, they need a unified approach that draws on the strengths of both. Success hinges on continuous visibility, automated optimization, and a governance-first mindset. CloudNuro empowers enterprise IT and Finance teams with the centralized control, analytics, and savings to confidently manage analytics modernization today and tomorrow.
About CloudNuro
CloudNuro is a leader in Enterprise AI Adoption Management, providing enterprises with unmatched visibility, governance, and cost optimization. Recognized twice in a row in the SaaS Management Platforms category and named a Leader in the SoftwareReviews Data Quadrant, CloudNuro is trusted by global enterprises and government agencies to bring financial discipline to SaaS, cloud, and AI. Trusted by enterprises, CloudNuro provides centralized SaaS inventory, license optimization, and renewal management along with advanced cost allocation and chargeback, giving IT and Finance leaders the visibility, control, and cost-conscious culture needed to drive financial discipline.
Request a no cost, no obligation free assessment —just 15 minutes to savings!
Get StartedToday’s enterprise analytics leaders face an unfamiliar paradox. Microsoft’s analytics stack offers both Microsoft Fabric, a powerful, unified analytics platform, and Power BI, the long-standing business intelligence standard. As organizations modernize the data stack, most find they aren't picking between the two, but unlocking greater value by knowing exactly when and how to use both in tandem.
This guide unpacks the real differences between Microsoft Fabric and Power BI, explains the capacity metrics that drive both cost and reporting performance, and explores best practices to monitor capacity and optimize spend. For IT, Finance, and analytics leaders, the right approach ensures cost control, governance, and true reporting agility.
Microsoft Fabric is the analytics foundation. It unites data engineering, data warehousing, data science, and real-time analytics into a single SaaS platform. Power BI is the visualization and reporting layer, the familiar window most users see. Fabric delivers the storage, compute, and transformation muscle, while Power BI orchestrates insight delivery for business users.
Some organizations run Power BI on its own; others now leverage Fabric as their central analytics hub. Increasingly, most use both, sometimes without even realizing it, as Microsoft blends their experiences.
| Feature | Microsoft Fabric | Power BI |
|---|---|---|
| Core Purpose | Unified Analytics Stack | BI/Visualization Front |
| Primary Users | Data Engineers, IT | Business Analysts |
| Capacity Model | Fabric SKUs (F) | Power BI Premium (P/E) |
| Key Metrics to Track | Capacity Units, GCUs | Workspace, Refresh |
| License Complexity | High (multi-workload) | Medium |
| Governance Need | High | Moderate |
Expert Insight:
"Microsoft Fabric is the foundation, while Power BI is the window; they are complementary solutions where the unified platform supercharges reporting rather than replacing it."
Clarity begins with use cases and workload profiles:
Microsoft Fabric:
Power BI:
Using Both (the New Normal):
Market Reality:
Whether using Fabric, Power BI, or both, capacity is the critical control point. Picking the wrong capacity SKU or failing to monitor usage leads directly to overspend, throttled reports, or compliance violations.
Key Statistic: Up to 40% of Microsoft Fabric customers are currently overprovisioned due to a lack of actionable visibility.
Key Fabric Capacity Metrics:
The capacity chapter is evolving:
Capacity Optimization Realities
Modern capacity management means more than viewing a dashboard. You need visibility down to the department, project, and workload; timely alerts on spikes; and proactive policies that prevent dual-running costs during migration.
Common Questions IT and Finance Teams Face:
CloudNuro helps by providing:
Proof of Value:
Modern enterprise teams should build a practice around four core principles:
Instead of relying on snapshots, automate continuous inventory of capacity units, license usage, and feature adoption for both platforms. This prevents data leakage and budget creep.
Implement intelligent workflows to continuously review and deprovision underused or orphaned licenses. This drives instant cost savings and tightens governance.
Use platforms (such as CloudNuro) that natively map capacity consumption for chargeback and showback, enforcing accountability for every unit of spend.
Timely alerts for spikes in refreshes, excessive capacity consumption, or unusual user activity let teams act proactively, not reactively.
Expert Insight:
"Successful optimization requires continuous visibility and automation rather than a one-time migration, as dynamic capacity models demand proactive governance to prevent budget drains."
CloudNuro’s AI-enabled SaaS operations platform sits at the intersection of governance, cost optimization, and analytics modernization. With end-to-end visibility across Microsoft Fabric, Power BI, and an ecosystem of 400+ data sources, CloudNuro enables IT and Finance teams to:
Leaders in healthcare, finance, government, and large enterprises trust CloudNuro to bridge the visibility and optimization gap as they migrate and modernize analytics platforms.
What is the difference between Microsoft Fabric and Power BI?
Microsoft Fabric is a unified analytics platform supporting data engineering, science, and storage, while Power BI serves as the business intelligence and visualization front-end. Fabric is about back-end data prep and compute; Power BI focuses on self-service reporting for business users.
When should I use Microsoft Fabric over Power BI?
Choose Fabric for complex or large-scale analytics, multi-source integration, advanced machine learning, or when granular governance and chargeback is required. Use Power BI for rapidly building and sharing interactive reports and dashboards, especially when advanced data prep is not needed.
How do fabric capacity metrics impact reporting?
Fabric capacity units determine how much compute and storage your workloads can use, impacting dashboard refresh times, concurrency, and overall reporting reliability. Poor capacity monitoring risks slow reports or unexpected costs.
Can you monitor capacity KPIs in both Microsoft Fabric and Power BI?
Yes. Capacity KPIs such as usage, spikes, concurrency, and orphaned licenses can and should be monitored across both platforms. Platforms like CloudNuro extend native capabilities by offering deeper, automated tracking and reporting.
What are best practices for fabric capacity monitoring?
Automate capacity tracking, set proactive alerts, continuously review license usage, and allocate costs at the department or project level. Governance and automation are key to ongoing optimization.
Organizations no longer need to choose between Microsoft Fabric and Power BI, they need a unified approach that draws on the strengths of both. Success hinges on continuous visibility, automated optimization, and a governance-first mindset. CloudNuro empowers enterprise IT and Finance teams with the centralized control, analytics, and savings to confidently manage analytics modernization today and tomorrow.
About CloudNuro
CloudNuro is a leader in Enterprise AI Adoption Management, providing enterprises with unmatched visibility, governance, and cost optimization. Recognized twice in a row in the SaaS Management Platforms category and named a Leader in the SoftwareReviews Data Quadrant, CloudNuro is trusted by global enterprises and government agencies to bring financial discipline to SaaS, cloud, and AI. Trusted by enterprises, CloudNuro provides centralized SaaS inventory, license optimization, and renewal management along with advanced cost allocation and chargeback, giving IT and Finance leaders the visibility, control, and cost-conscious culture needed to drive financial discipline.
Request a no cost, no obligation free assessment - just 15 minutes to savings!
Get StartedWe're offering complimentary ServiceNow license assessments to only 25 enterprises this quarter who want to unlock immediate savings without disrupting operations.
Get Free AssessmentGet Started




CloudNuro Corp
1755 Park St. Suite 207
Naperville, IL 60563
Phone : +1-630-277-9470
Email: info@cloudnuro.com





.webp)

Recognized Leader in SaaS Management Platforms by Info-Tech SoftwareReviews
%20Tools%20for%20Governance%20(2025%20Guide).png)



.svg)